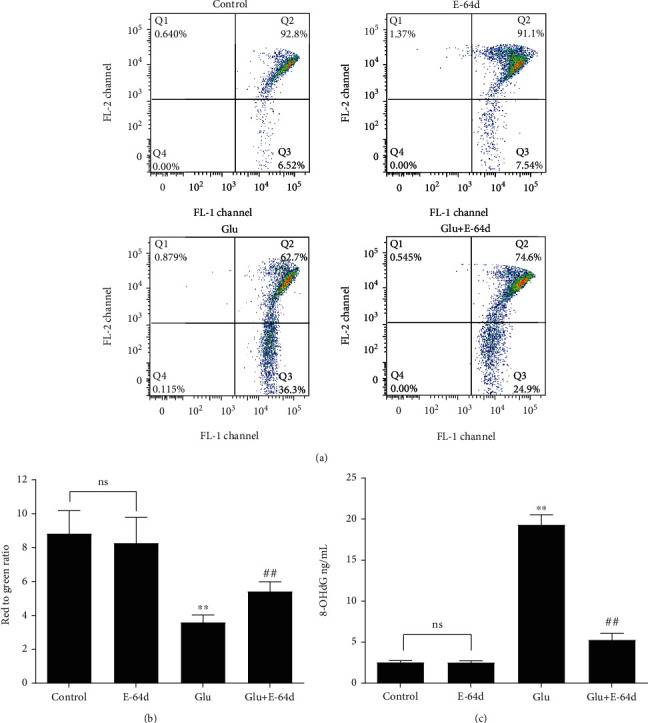
Figure 4.

Effect of E-64d on glutamate-induced changes in mitochondrial membrane potential in terms of JC-1 activity and oxidative stress, as detected via ELISA. (a) Measurement of mitochondrial membrane potential via flow cytometry. (b) Quantitative analysis of mitochondrial membrane potential in HT22 cells. (c) Quantitative analyses of the average levels of 8-OHdG in cells. Three independent experiments were performed, and the data are expressed as the mean ± SD. ∗∗P < 0.01 vs. the Control group. ##P < 0.01 vs. the Glutamate group. n.s.: not significant.
