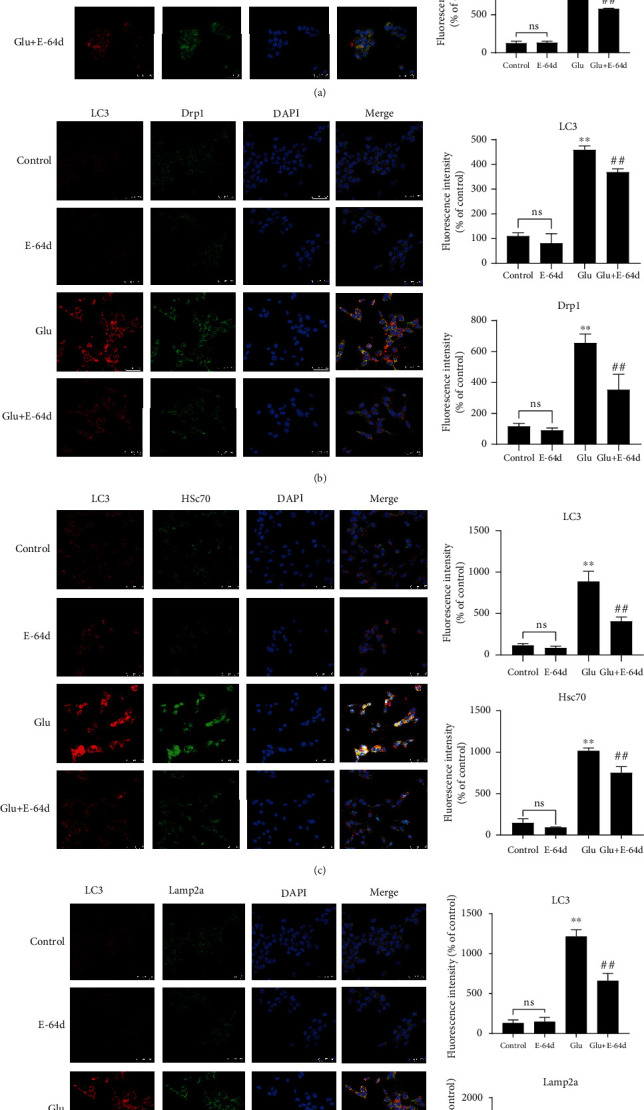
Figure 6.

Effect of E-64d on protein expression of Cytc (a), Drp1 (b), Hsc70 (c), and Lamp2a (d) in HT22 cells, as determined by laser confocal microscopy. The four groups were stained with anti-LC3 antibodies (red); anti-Cytc, Drp1, Hsc70, and Lamp2a antibodies (green); and DAPI (blue, cell nuclei labeling). The results of the quantitative analysis of average fluorescence intensity are shown. ∗∗P < 0.01 vs. the Control group. ##P < 0.01 vs. the Glutamate group. n.s.: not significant.
