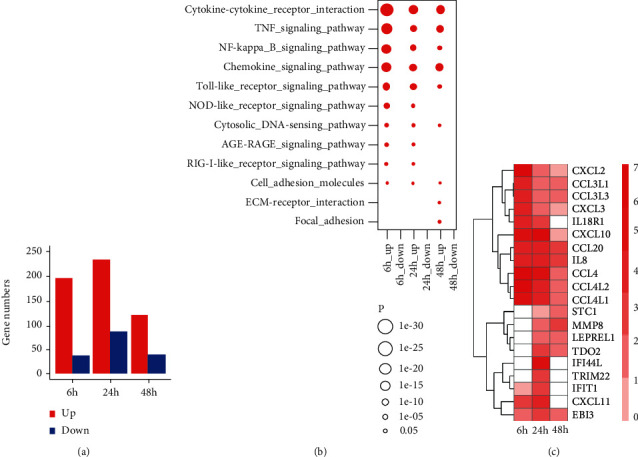
Figure 1.

Differential gene analysis for M. tuberculosis H37Rv-infected macrophages by RNA-sequence. (a) Number of differentially expressed genes at time points of 6, 24, and 48 h in M. tuberculosis H37Rv-infected macrophages. (b) Red circle size means significant enrichment of upregulated genes by KEGG pathway enrichment. Each score represents base 10 to the minus 5 logarithm of enrichment P values. (c) Gene expression signature of top 10 upregulated differentially expressed genes from each time point of M. tuberculosis H37Rv-infected macrophages. The colour denotes log2 fold change of gene expression. Colour red indicates upregulation and blue means downregulation.
