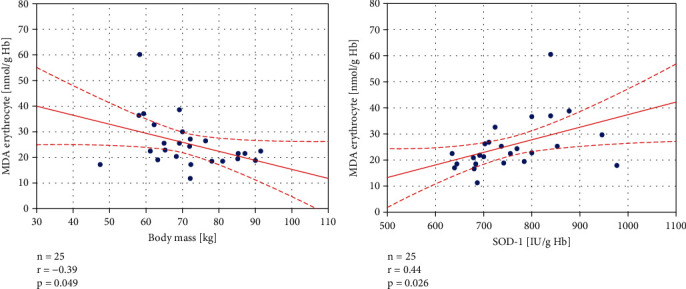
Figure 5.

Statistically significant correlations in the healthy, control group between erythrocyte malondialdehyde (MDA) level and body mass, erythrocyte MDA concentration, and Zn/Cu-superoxide dismutase (SOD-1) activity. The regression line is marked with a solid line, while the confidence intervals of 0.95 are marked with a dashed line.
