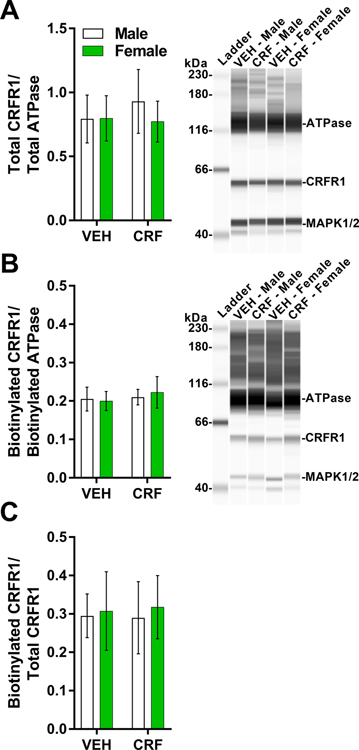
Figure 7. Intra-BLA CRF treatment did not alter total or biotinylated (cell-surface) CRFR1 expression in the BLA.
Male and female rats received bilateral infusions of CRF (30 ng/hemisphere) or vehicle (VEH; DMSO) into the BLA. BLA tissue was collected 30 min later for cell-surface protein biotinylation and analysis total and biotinylated protein levels using an automated capillary electrophoresis immunoassay on the Wes ProteinSimple instrument. (A) Total of CRFR1 area under the curve (AUC) values normalized to total ATPase (loading control) AUC values (mean ratio of AUCs ± SEM). Representative digital western blot image generated by Compass for SW software v4.0.0 (ProteinSimple). The bands corresponding to protein peaks observed for ATPase (99 or 129 kDa), CRFR1 (61 kDa), and MAPK1/2 (41 and 45 kDa) in the total and biotinylated (acetone precipitated) fractions, respectively. See Fig. S5 for representative electropherograms used to measure AUC. MAP1/2 was measured as an indicator of BLA cell integrity. (B) Biotinylated (cell-surface) CRFR1 normalized to biotinylated ATPase (loading control) (mean ratio of AUCs ± SEM). Representative digital western blot image generated by Compass for SW software (ProteinSimple, v4.0.0). A separate, high-contrast image of the ladder was taken and superimposed on the original to increase image quality. (C) Ratio of normalized biotinylated to normalized total CRFR1 AUC values (mean ± SEM).

