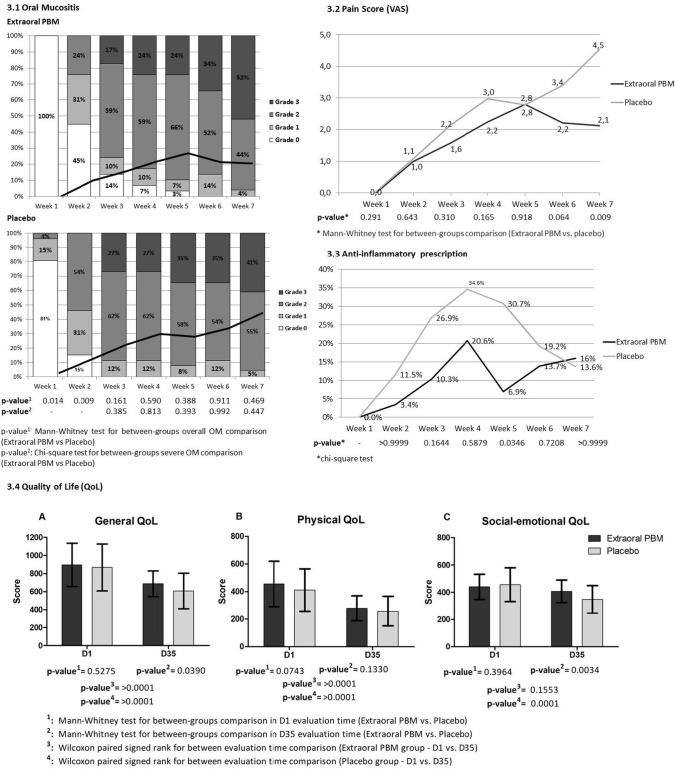
Fig. 3.
Clinical assessments. 3.1: Oral Mucositis—Weekly oral mucositis assessment according to the National Cancer Institute (NCI, version 4.0; 2010). Bars represent percent of cases in each oral mucositis grade and continuous lines represent mean values for each stage (score range from 0 to 4); 3.2 Pain Score—Oral mucositis associated pain score (visual analogue scale – VAS); 3.3: Anti-inflammatory prescription at the different weeks of RT treatment; 3.4 Quality of life—Graphs comparing mean (± SD) University of Washington Quality of Life Questionnaire (UW-QoL v4) score at baseline (D1) and final session of radiotherapy (D35). Graph A, general QoL; graph B, physical QoL; graph C, social-emotional QoL

