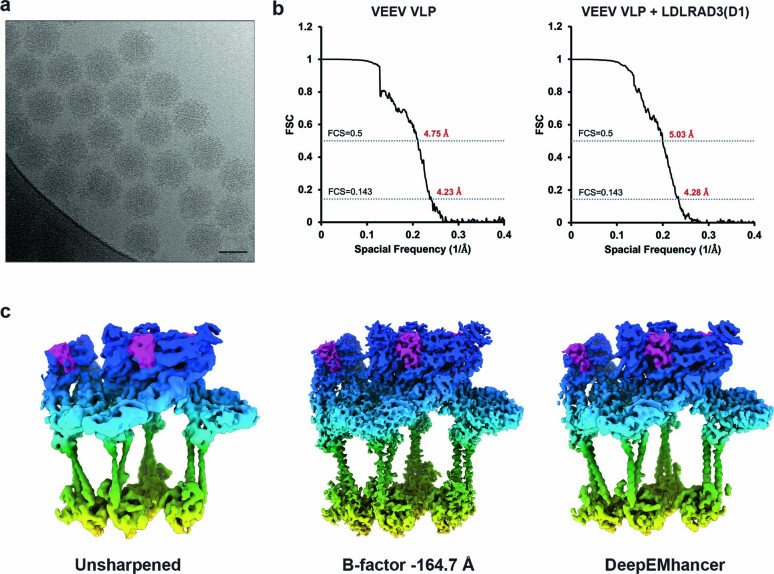
Extended Data Fig. 1. Quality assessment of cryo-EM maps.
a, Representative electron micrograph (micrograph number, 1453) of VEEV VLPs. Scale bar, 500 Å. b, Fourier shell correlation (FSC) plots for VEEV VLPs alone (left) and with LDLRAD3(D1) (right). c, Side views of the unsharpened (left), globally sharpened by RELION postprocessing (middle) or modified by DeepEMhancer (right) electron densities of one asymmetric unit of VEEV–LDLRAD3 complex. The maps are coloured by radial distance from the VLP center, with LDLRAD3(D1) shown in purple, analogous to in Fig. 1b.

