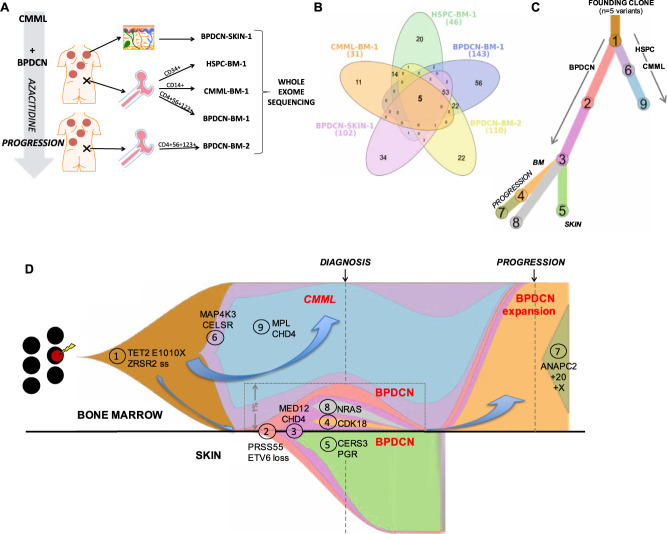
Fig. 1. Early divergent clonal evolution of CMML and BPDCN from a shared founding clone.
A Schematic of experimental setup and samples used for whole exome sequencing from the index patient. B Venn diagram showing the distribution of all somatic variants identified across the five sequenced exomes (n = 249). C Phylogenetic evolution tree for the nine distinct mutation clusters identified by SciClone across the five sequenced exomes; clusters unique to specific compartments are indicated in parentheses. D Composite fish plot depicting the clonal architecture and evolution in our index patient. Each color represents the indicated clone and aligns with color scheme in (C); cluster numbers were automatically assigned by SciClone and are annotated on the plot. Selected exemplar mutations for each defined cluster are also labeled. Block arrows emphasize the distinct evolution paths toward CMML and BPDCN, and then for the BPDCN marrow expansion at disease progression. For enhanced clarity, the clonal arrangement within the small BPDCN-BM-1 clone (representing 1.08% of total marrow cells by flow cytometry) is expanded within the inset, as indicated. Similarly, the plot for the contemporaneous presentation skin sample (BPDCN-SK-1) is inverted/transposed, to display clonal evolution in this tissue separately from the bone marrow-derived samples (rather than in misleading linear series).

