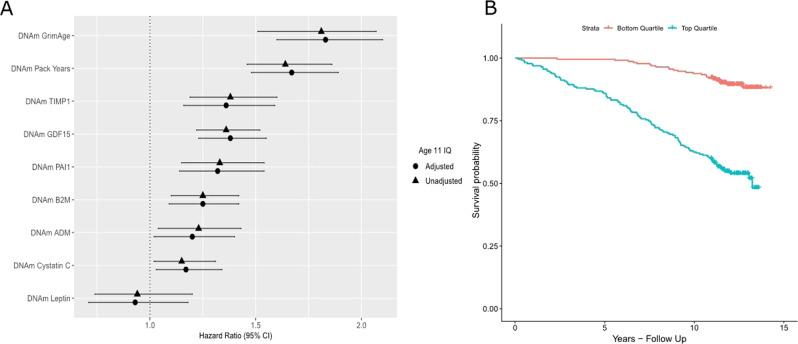
Fig. 1.
DNAm GrimAge and its component surrogate markers predict mortality in the LBC1936. a Forest plot showing hazard ratios and 95% confidence intervals (horizontal lines) from Cox proportional hazard models for DNAm GrimAge and its constituent DNAm surrogate markers in the LBC1936 (n = 906, no. of deaths = 226 following nine years of follow-up). All associations with the exceptions of DNAm Leptin were significant. b Kaplan–Meier survival curve exhibiting the survival probabilities for the top (highest DNAm GrimAge) and bottom quartiles (lowest DNAm GrimAge) for DNAm GrimAge in the LBC1936 following 9 years of follow-up

