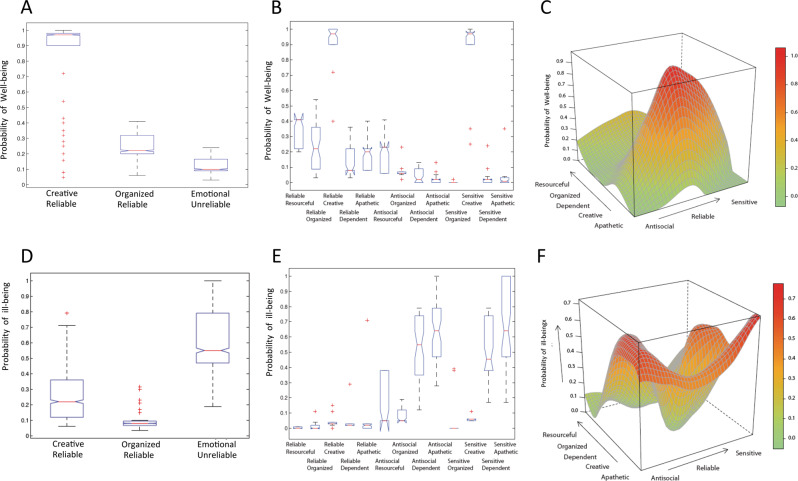
Fig. 3.
Evaluation of the probability of health measured for Temperament and Character associations in the three phenotypic subnetworks using ANOVA statistics (p value < 1E−20), and T-test among the three subnetworks. The three networks, Creative-Reliable, Organized-Reliable, and Emotional-Unreliable, significantly differ from each other (p value < 1E−04) in their probability of well-being (a) and ill-being (d). b, e Evaluation of probability of health in Temperament and Character Sets and their relationships with SNP Sets using ANOVA statistics. b Well-being and e Ill-being evaluated for Temperament and Character Sets with respect to their profiles. c, f Surfaces representing the health function of the uncovered relationships between Temperament and Character Sets. The probability of health (z-axis; red high; green: low) was calculated based on the distribution of the status of subjects within each relationship, and the surface was plotted interpolating the relation domains. The order adopted for plotting relationships are calculated based on clustering shared subjects in Character (x-axis) and in Temperament (y-axis) Sets using Hypergeometric statistics (see “Method” section). (Close-located sets in an edge share more subjects than those located far away.) c Well-being surface. f Ill-being surface

