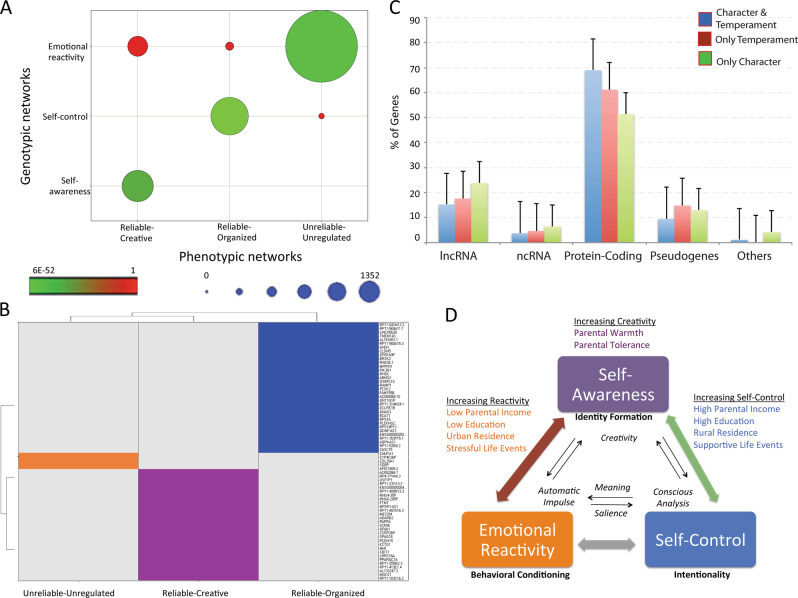
Fig. 4.
a Correlation between the phenotypic (Fig. 1a) and the genotypic (Fig. 1b) networks (p < 6E−52, Hypergeometric statistics). Color codes indicate low (red) to high (green) statistical significance. The size of the circles indicates the number of coincident phenotypic–genotypic relationships. b Relationships among key genes associated with Temperament and Character Sets that discriminate the three networks shown in Fig. 1a, b: self-awareness (violet), self-control (blue), and emotional reactivity (orange). (See AND/OR relationships in Fig. S5.) c Types of genetic variants mapped by SNP sets associated with character: specific molecular consequences [genes related only to character sets (green) were less often protein coding and more often RNA genes than those also associated with temperament sets (red color), or genes related to both character and temperament exhibit higher proportion of protein-coding genes. See subtypes in Fig. S4B]. d Relationships among environmental sets associated with Genotypic subnetworks (Fig. 1). Environmental sets can belong to one or more networks

