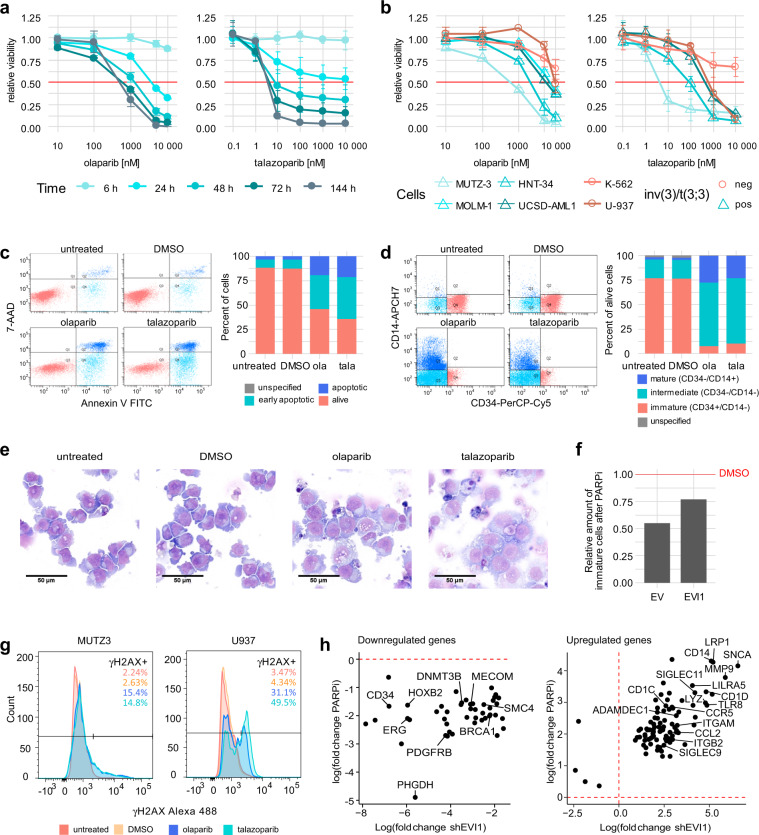
Fig. 4. PARP1 inhibition (PARPi) causes phenotypical changes and apoptosis of MUTZ-3 cells.
a, b Sensitivity of different cell lines to PARPi. Cells were treated with the indicated amounts of olaparib or talazoparib. Shown is the mean ± SD (n = 3). Metabolic activity was measured as an indicator of cell viability by CellTiter-Glo assay. Values were normalized to those of the 0 h time point and to the DMSO control of each time point. a Viability of MUTZ-3 cells across multiple time points. b Comparison of several 3q-rearranged and non-rearranged cell lines at 72 h. c–e Effects of PARPi treatment in MUTZ-3 cells. Cells were treated with 10 µM olaparib (ola), 1 µM talazoparib (tala), or DMSO or were left untreated for 24 h. c Apoptosis staining with Annexin-V and 7-AAD and flow cytometric analysis. The graphs show one representative replicate. d Flow cytometric analysis of differentiation markers. Cells were gated for the live population. The graphs show one representative replicate. e Representative images of May-Grünwald-Giemsa staining of control and PARPi treated MUTZ-3 cells. f EVI1 overexpression partially rescues loss of immature cells after PARPi. MUTZ-3 cells were transduced using a lentiviral expression vector containing EVI1 or the corresponding empty vector (EV) control. After selection with puromycin, cells were treated with 10 µM olaparib or DMSO for 24 h. Differentiation markers were assessed by flow cytometry. Cells were gated for the live cell population. The amount of immature (CD34 + /CD14−) cell population of PARPi treated cells was normalized to the DMSO control. The graph shows one representative replicate. g DNA damage response after PARPi in MUTZ-3 and U-937. Intracellular γH2AX levels of untreated cells or cells treated with DMSO, 10 µM olaparib, or 1 µM talazoparib were assessed by flow cytometric analysis. Cells were gated for the single cell population. h Commonly downregulated (left) and upregulated (right) genes by PARPi and EVI1 knockdown as identified by RNA-Seq. Genes included in cluster 3 of the PARPi data were compared to the genes deregulated by EVI1 knockdown to determine the genes downregulated by both conditions. Upregulated genes in cluster 4 of the PARPi RNA-Seq data were determined accordingly. Fold change of gene expression under treatment conditions (PARPi or shEVI1, respectively) over the control (DMSO or non-targeting control, respectively) is shown. Exemplary genes are annotated.

