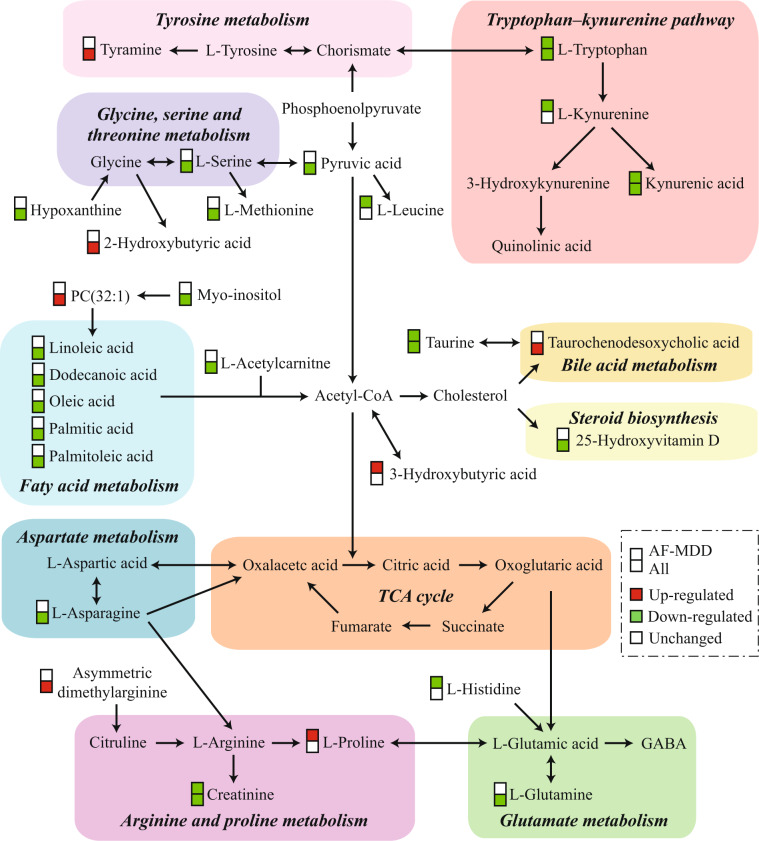
Fig. 1. A simplified schematic diagram of the altered metabolic pathways in the blood of patients with MDD.
For differential metabolites, boxes in red represent increased levels, boxes in green represent decreased levels, and boxes in white represent no significant change when compared with controls. Upper and lower boxes represent antidepressant-free major depressive disorder (AF-MDD) and all patients, respectively. Acetyl-CoA acetyl coenzyme A; GABA gamma-aminobutyric acid; MDD major depressive disorder; PC phosphatidylcholine; TCA tricarboxylic acid cycle.

