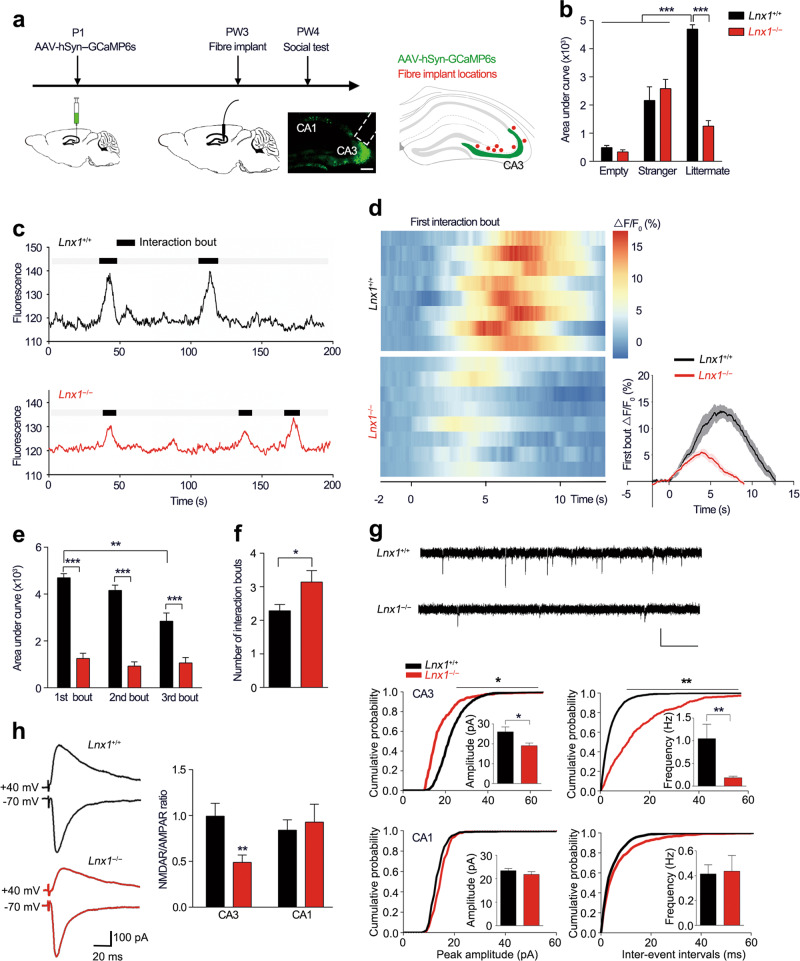
Fig. 2.
Lnx1 deletion decreases CA3 neuronal reaction to social recognition and synaptic activity. a Schematic of fibre recording experimental set-up and localization of optical fibre (red dots) in CA3 area. b Quantification of area under ΔF/F curve of empty, stranger, or littermate interaction in PW3 WT and Lnx1−/− mice. n = 5 for WT or Lnx1−/− mice interact with empty or stranger and n = 8 mice for littermate. c Representative traces of bulk fluorescence signal from hippocampal CA3 neurons, with black areas indicating interaction bouts. Black line for WT mice and red line for Lnx1−/− mice. d Heat maps (left) showing the ΔF/F in response to the first interaction bout for two-group mice. Time course (right) of average GCaMP6s event-locked to interaction with littermate for the 1st interaction bout, n = 8 mice for per group. e Quantification of area under ΔF/F curve of 1st, 2nd, and 3rd interaction bout. n = 7 mice for per group. f Interaction bouts of investigation with littermate for WT mice and Lnx1−/− mice. n = 7 mice for per group. g Representative traces of mEPSC recorded (upper), Scale bar: 20 pA (vertical) × 0.5 s (horizontal). Summary of cumulative probability of mEPSC amplitudes and frequency in CA3 (middle) and CA1 (bottom) pyramidal neurons. Insets show average mEPSC amplitudes and frequency. n = 16 neurons from five WT mice and n = 21 neurons from five Lnx1−/− mice for CA3 area, n = 13 neurons from three WT mice and n = 15 neurons from four Lnx1−/− mice for CA1 area. h Representative traces of AMPAR EPSCs recorded at −70 mV and NMDAR EPSC at +40 mV. Scale bar: 100 pA (vertical) × 20 ms (horizontal). Ratio of NMDAR/AMPAR in CA3 and CA1 were quantified respectively for per group. n = 16 neurons from three WT mice and n = 14 neurons from five Lnx1−/− mice for CA3 area, n = 9 neurons from three WT mice and n = 9 neurons from three Lnx1−/− mice for CA1 area. Data are presented as mean ± SEM. *P < 0.05; **P < 0.01; ***P < 0.001; two-way ANOVA with Turkey’s multiple comparison post hoc test (b, e) and unpaired t-test (f, g, h)

