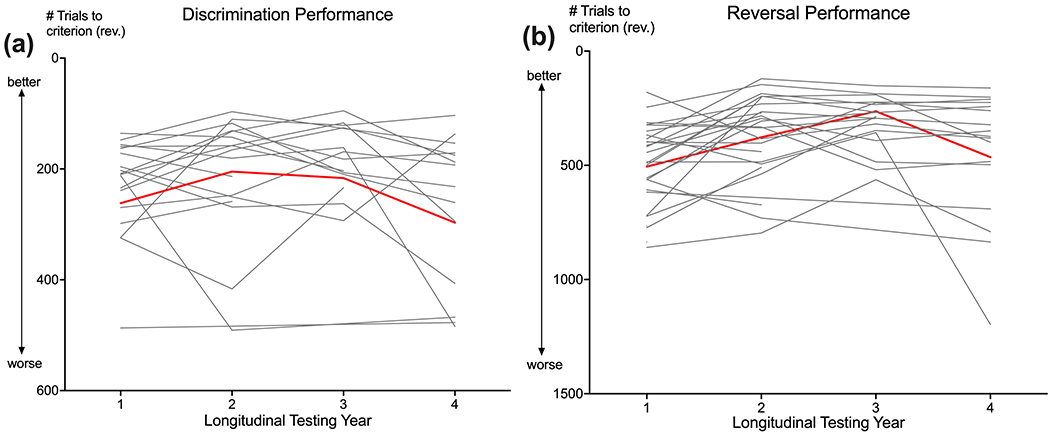
Figure 1. Cognitive aging trajectories.

Trajectories of cognitive performance on trials to criterion for (a) discrimination and (b) reversal testing across a 4-year longitudinal study spanning middle to old age. Performance is measured by the number of trials to criterion, with fewer trials representing better performance. Red lines represent the average aging trajectories for all marmosets (N=27) and gray lines represent individual marmosets. Average age at Testing Year 1 was 4.97 years old (SD = 0.64; 3.96 to 6.86 years).
