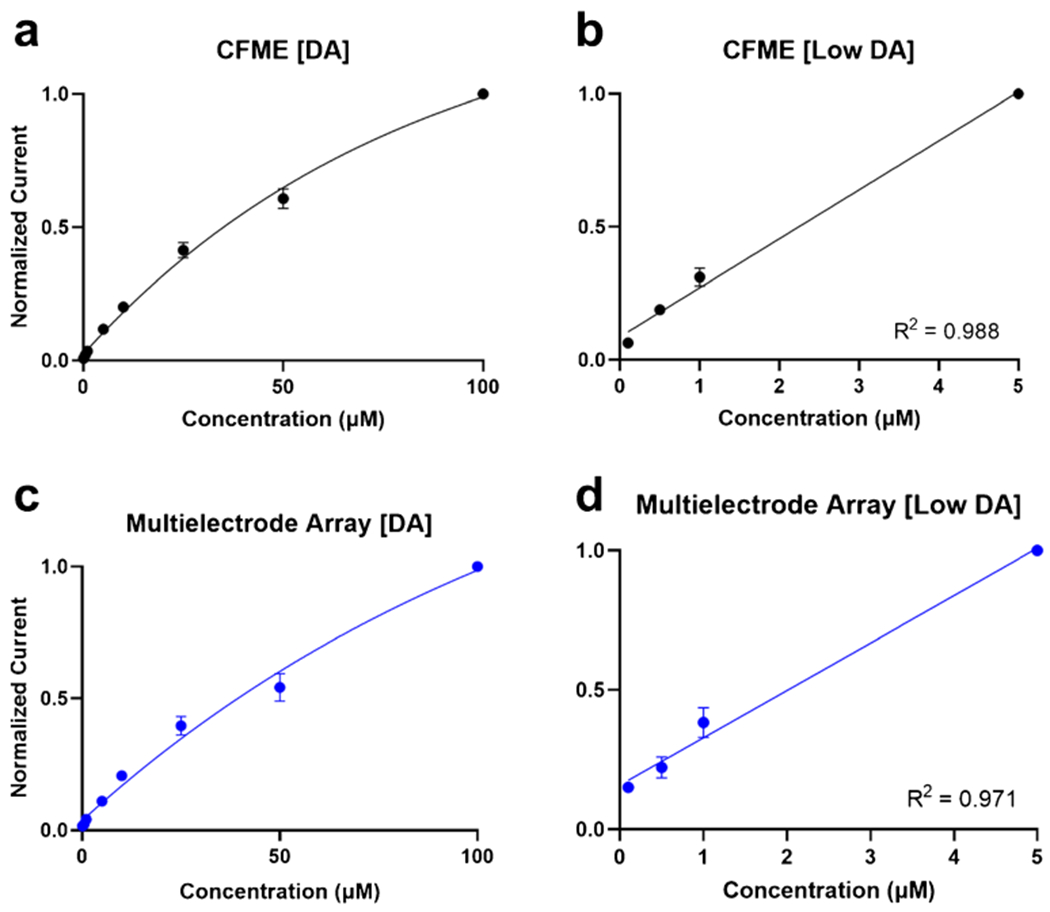
Fig. 4.

Dopamine concentration curve ranging from 1 to 100 μM for the a CFME and c multielectrode array, highlighting the lower concentration linear relationship of the CFME (b) and multielectrode array (d). Error bars are shown as standard error of the mean (N = 3 for each electrode type)
