
Fig. 7.
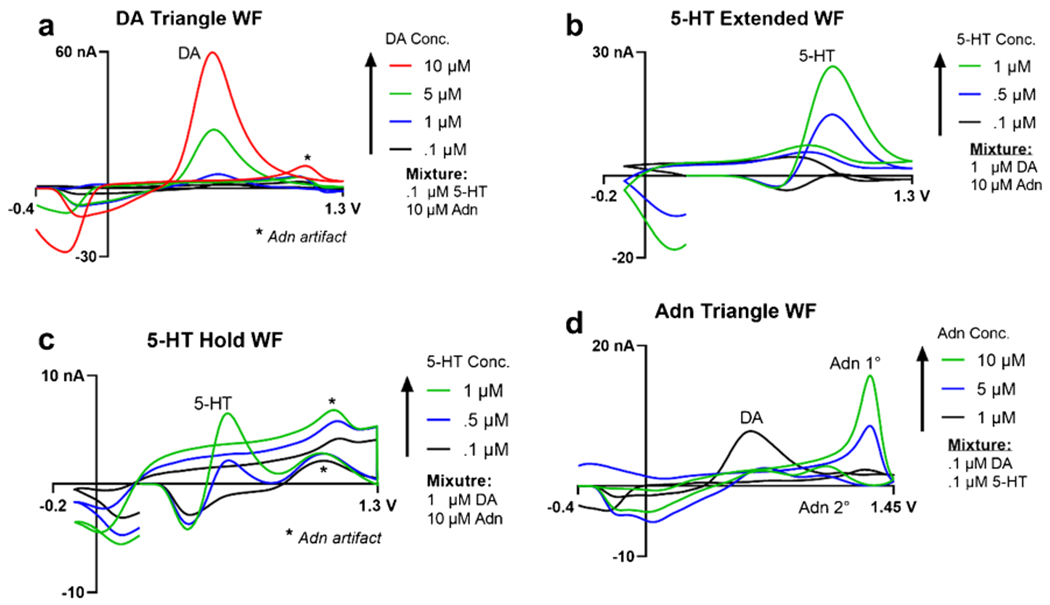
Co-detection of DA, 5-HT, and adenosine (Adn) using their respective waveforms and with varying concentration ratios. a DA was co-detected using the DA triangle waveform on channel 1 with increasing concentrations from 100 nM to 10 μM and in a mixture of 100 nM 5-HT and 10 μM adenosine. Asterisks in a and b indicate artifact signal from the adenosine analyte. b 100 nM to 1 μM 5-HT was co-detected using the EWF on channel 2 and the c EHWF on channel 3 with 1 μM DA and 10 μM adenosine. d Adenosine was co-detected from 1 to 10 μM in a mixture of 100 nM 5-HT and DA, each, on channel 4 using the triangle waveform