
TABLE 3.
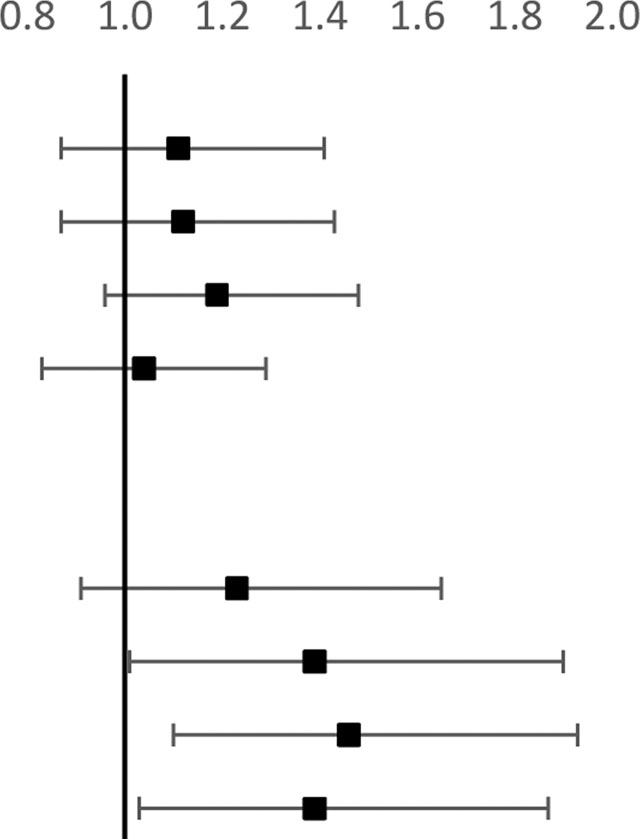
Population-Adjusted Relative ED Visit Rates for Youth Suicidal Ideation and/or Self-Harm by Urban-Rural Location of Residence
| ED Visit Type | Adjusteda Incidence Rate Ratio (95% CI) | |
|---|---|---|
| Suicidal Ideation and/or Self-Harm |
|
|
| Large Metropolitan | Ref | |
| Medium Metropolitan | 1.11 (0.87, 1.41) | |
| Small Metropolitan | 1.12 (0.87, 1.43) | |
| Micropolitan | 1.19 (0.96, 1.48) | |
| Noncore | 1.04 (0.83, 1.29) | |
| Self-Harm | ||
| Large Metropolitan | Ref | |
| Medium Metropolitan | 1.23 (0.91, 1.65) | |
| Small Metropolitan | 1.39 (1.01, 1.90)b | |
| Micropolitan | 1.46 (1.10, 1.93)b | |
| Noncore | 1.39 (1.03, 1.87)b | |
a.
Adjusted for age, sex, and U.S. Census Region
b.
P < 0.05