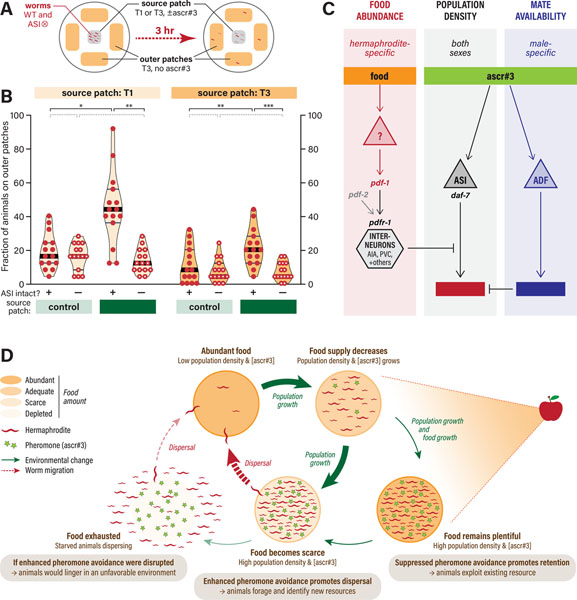
Figure 6. Modulation of ascr#3 aversion by food thickness enables flexibility in C. elegans foraging decisions.
(A) Experimental design. (B) Foraging rates, shown as the frequency of animals dispersing to the outer food sources, of WT and ASI⨂ hermaphrodites placed on a source patch of thick (T3) or thin (T1) food, without (−) or with (+) ascr#3. Each data point represents a single assay containing 25 worms per genotype. Filled and open circles indicate control and ASI-ablated animals, respectively. Violin plots are shaded according to food thickness at the source patch (T1, lighter; T3, darker). The median and interquartile intervals are indicated by thick and thin black lines, respectively. Statistical comparisons between groups are indicated with black brackets and asterisks (*p ≤ 0.05; **p ≤ 0.005; ***p ≤ 0.001) or dotted gray brackets (p > 0.05). (C) A neural circuit model showing the parallel inputs of food abundance, ascr#3 via ASI, and ascr#3 via ADF. Hermaphrodite- and male-specific aspects are shown in red and blue, respectively. (D) A proposed model illustrating the adaptive value of context-dependent flexibility in C. elegans foraging behavior driven by modulation of ascr#3 avoidance.

