
Figure 1. Adipocytes deficient in Pcpe2 have elevated SR-BI expression.
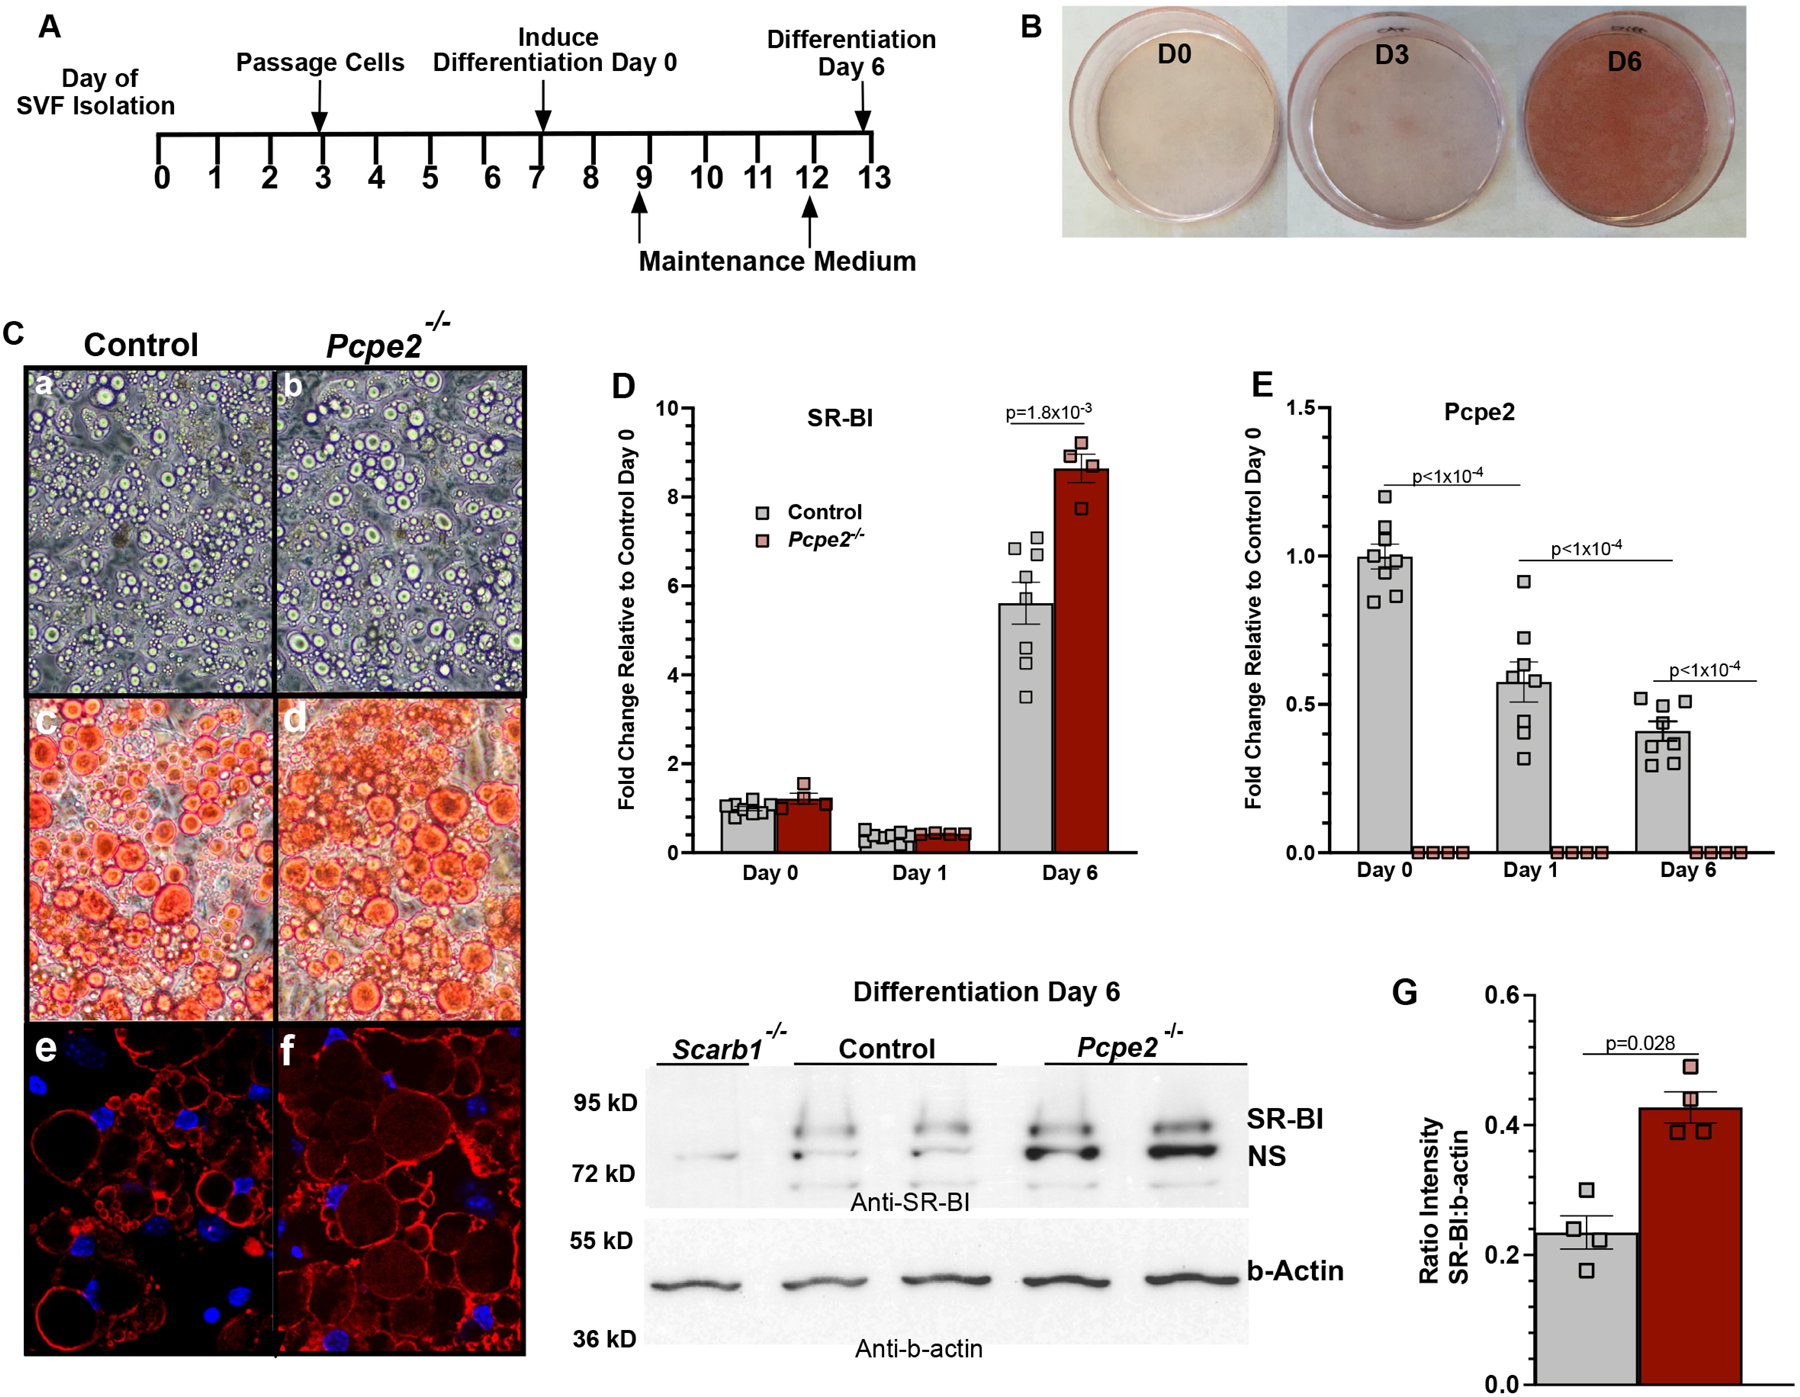
(A) Timeline for SAT SVF isolation and differentiation from Ldlr−/− (control) and Ldlr−/−/Pcpe2−/− (Pcpe2−/−) male mouse adipose tissue (B) Neutral lipid droplets in differentiated adipocytes on day 0 (D0), day 3 (D3) and day 6 (D6) visualized by Oil Red O staining. (C) Micrographs of lipid droplets from control andPcpe2-/−. Images represent phase contrast images (10X) (panels a,b), Oil Red O staining of neutral lipids (40X) (panels c,d) and perilipin-stained droplet membranes and DAPI stained nuclei by confocal microscopy (40X) (panels e,f). (D-E) Fold change in mRNA abundance on indicated day of differentiation for SR-BI and Pcpe2. RT PCR values represent the mean ± SD, n=4–8 male mice per genotype. Data analyzed by ANOVA with Tukey’s multiple correction test. (F) Western blots were probed for SR-BI and b-actin using protein extracts (n=2 male mice per genotype) from day 6 differentiated SVF adipocytes. Note: NS= non-specific protein similar in molecular weight to SR-BI was detected in adipocytes from SR-BI knockout tissue (Scarb1−/−). (G) Quantification of the SR-BI intensity relative to b-actin.