
Figure 2. Increased Expression of SR-BI in adipose tissue in the absence of Pcpe2.
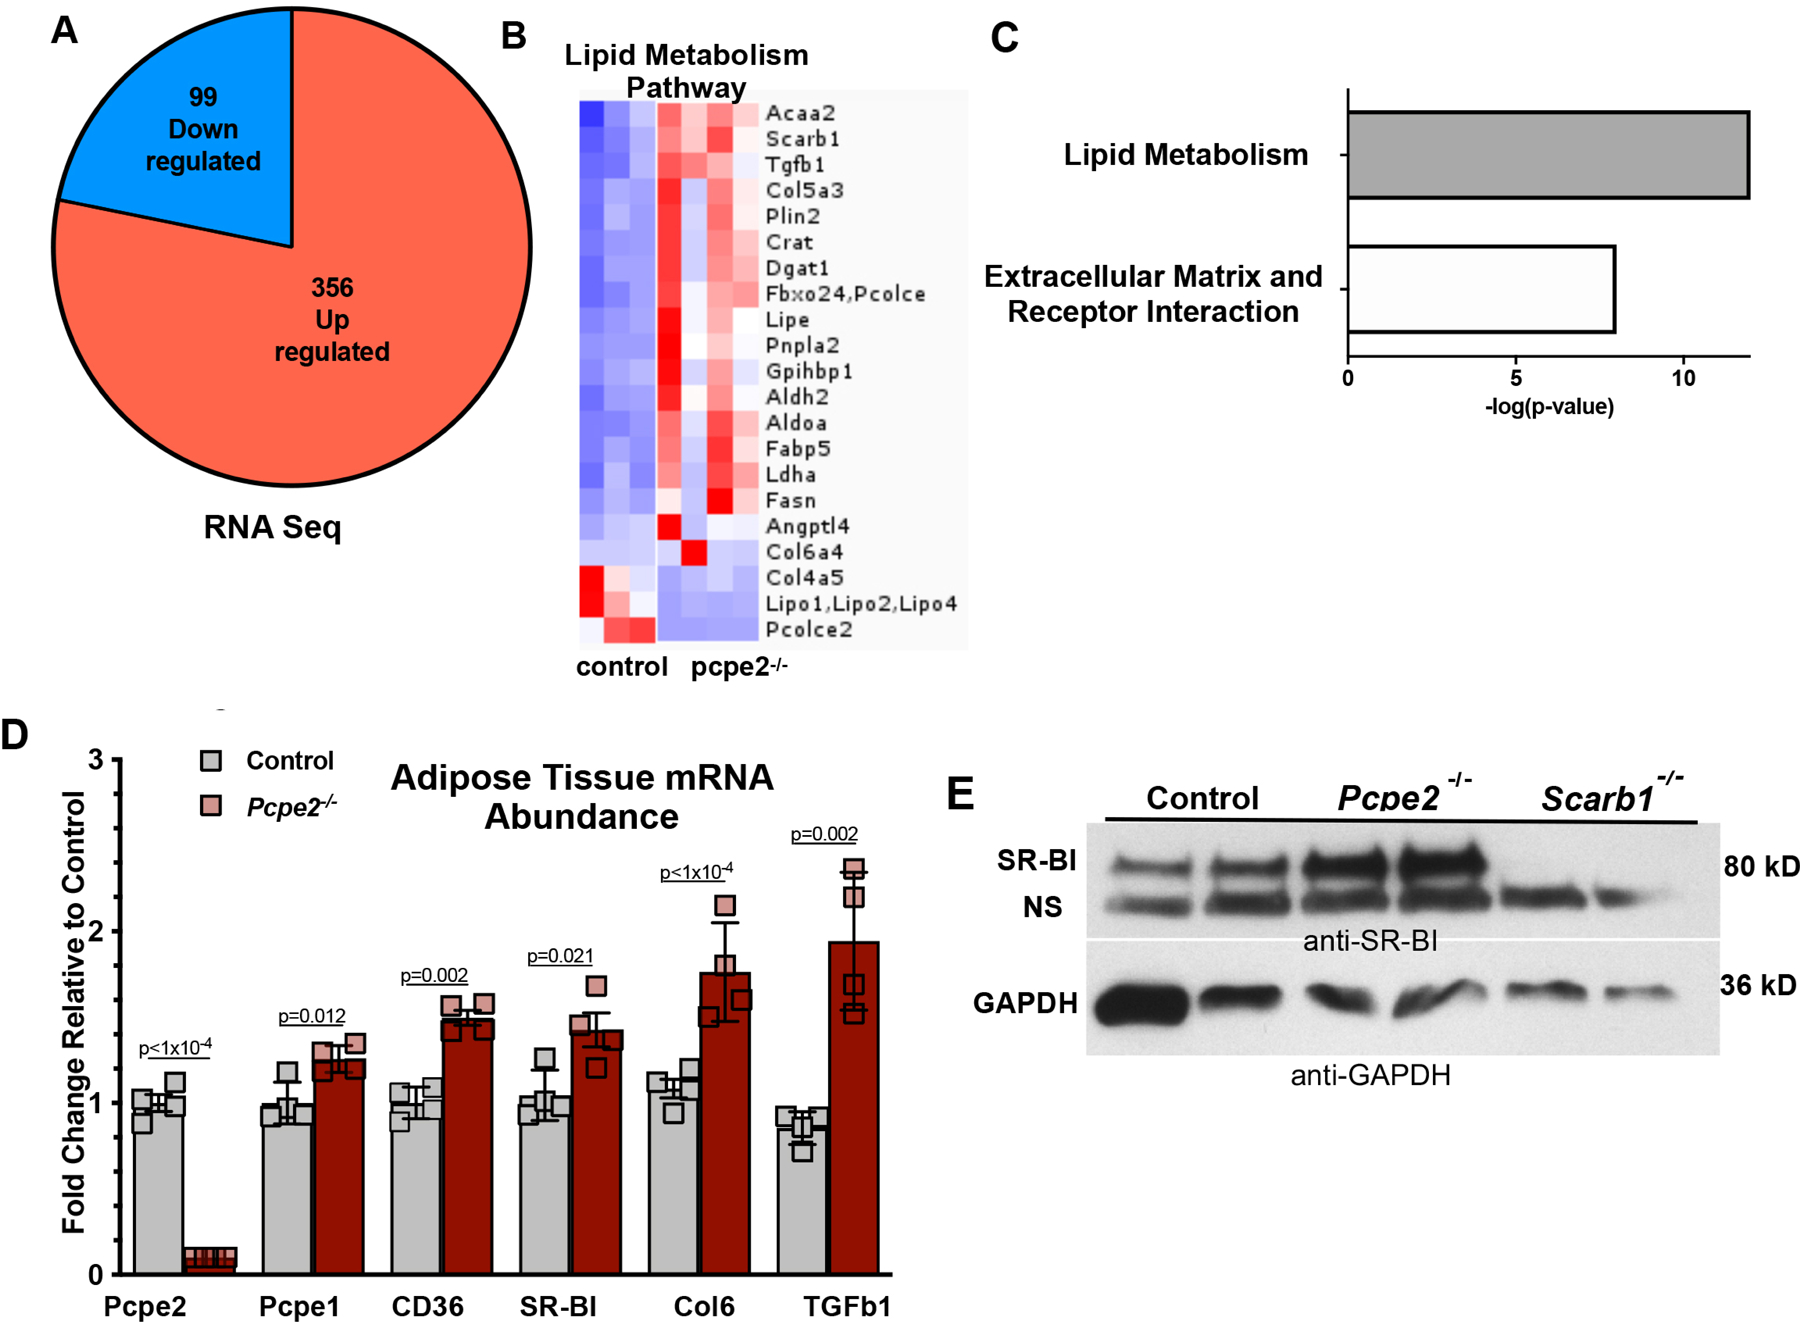
(A) Sequencing of adipose tissue RNA from Ldlr−/− (control) and Ldlr−/−/Pcpe2−/− (Pcpe2−/−) mice showed 99 down regulated (blue) and 356 upregulated (red) differentially expressed genes (DEG) in aged-matched male mice (n=3–4 per genotype) fed HFHC diet for 25 weeks (FDR <0.01; log2(FC)=1.5). A complete list of differentially expressed VAT genes in Supplemental Table I. (B) Heatmap of DEG. (C) Ingenuity pathway analysis showed lipid metabolism and extracellular matrix-receptor pathways as the most highly represented. (D) RT PCR mRNA abundance in male diet-fed VAT for selected genes. Data expressed as mean +/− SD. (E) Western blot analysis of SR-BI abundance from VAT protein extracts from male control and Pcpe2−/− mice fed a HFHC diet for 25 weeks. VAT protein extracts from Ldlr−/−/Scarb1−/− mice were included as a negative control. Note: NS=non-specific protein similar in molecular weight to SR-BI was detected in SR- BI knockout VAT protein extracts. Images are representative of two independent Western blot experiments.