
Figure 5. Hypertrophy and reduced cholesterol content are observed in Pcpe2- deficient mouse adipose tissue.
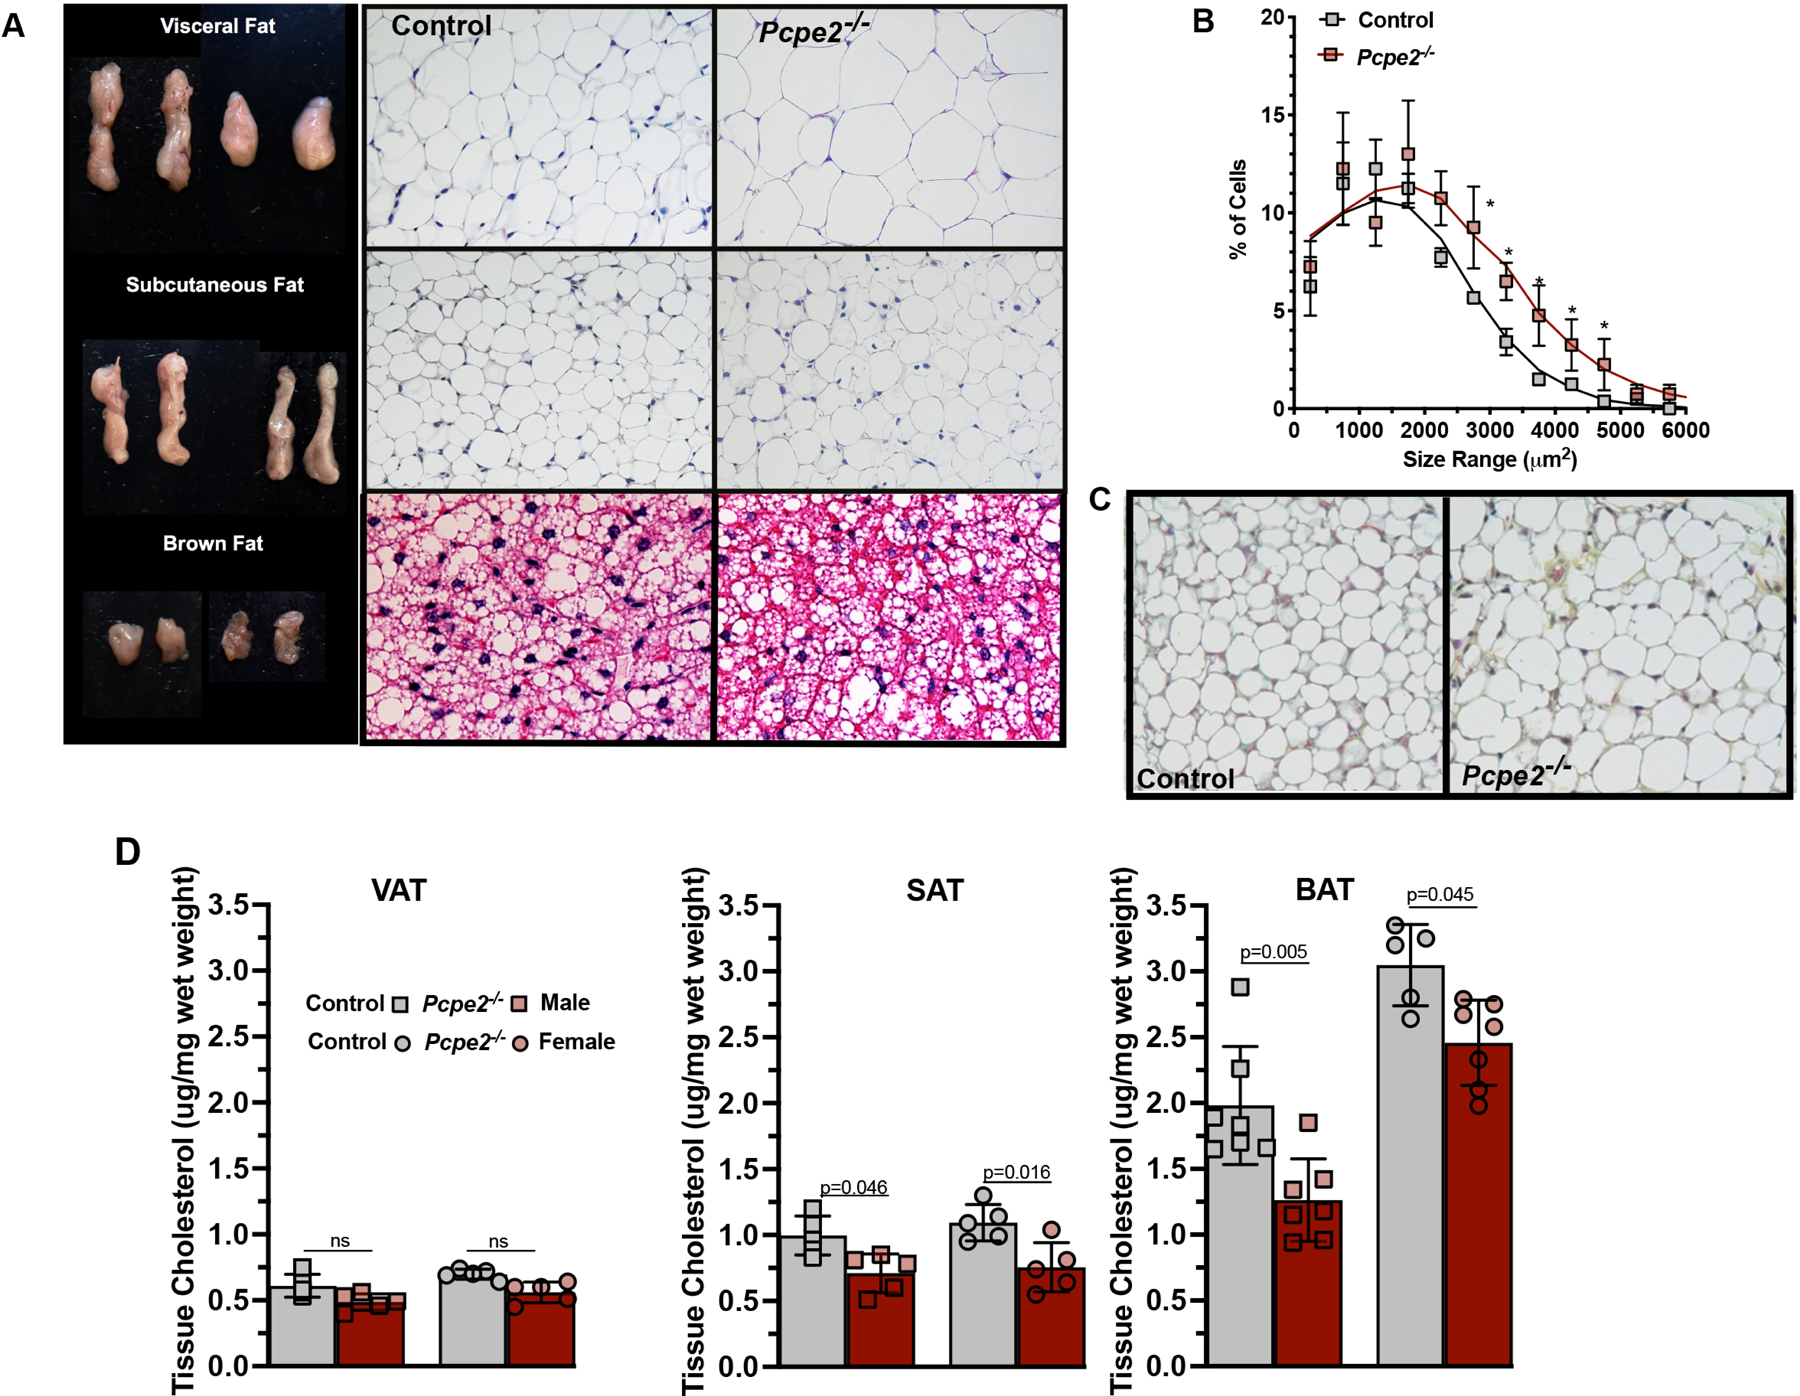
(A) Representative fat pads from VAT, SAT, and BAT from indicated genotypes and their corresponding H & E-stained images (20X) are shown. (A) The percent of VAT cells within a given size range for every 100-um2 area was determined from tissue from four male mice per genotype (>500 cells counted/genotype). *p<0.05. (C) Images of Movat’s pentachrome staining of SAT (20X) from Ldlr−/− (control) and Ldlr−/− Pcpe2−/− (Pcpe2−/−) mice suggest similar collagen content between genotypes. (D) Male and female control and Pcpe2−/− mice were fed HFHC diet for 25 weeks, sections of VAT, SAT and BAT tissue were taken at the time of necropsy and extracted lipids were analyzed by GC-mass spectrometry for total cholesterol and normalized to wet weight. All values represent the mean ± SD, n=5– 8 male and female mice per genotype. Data were analyzed by ANOVA with Tukey’s multiple correction test.