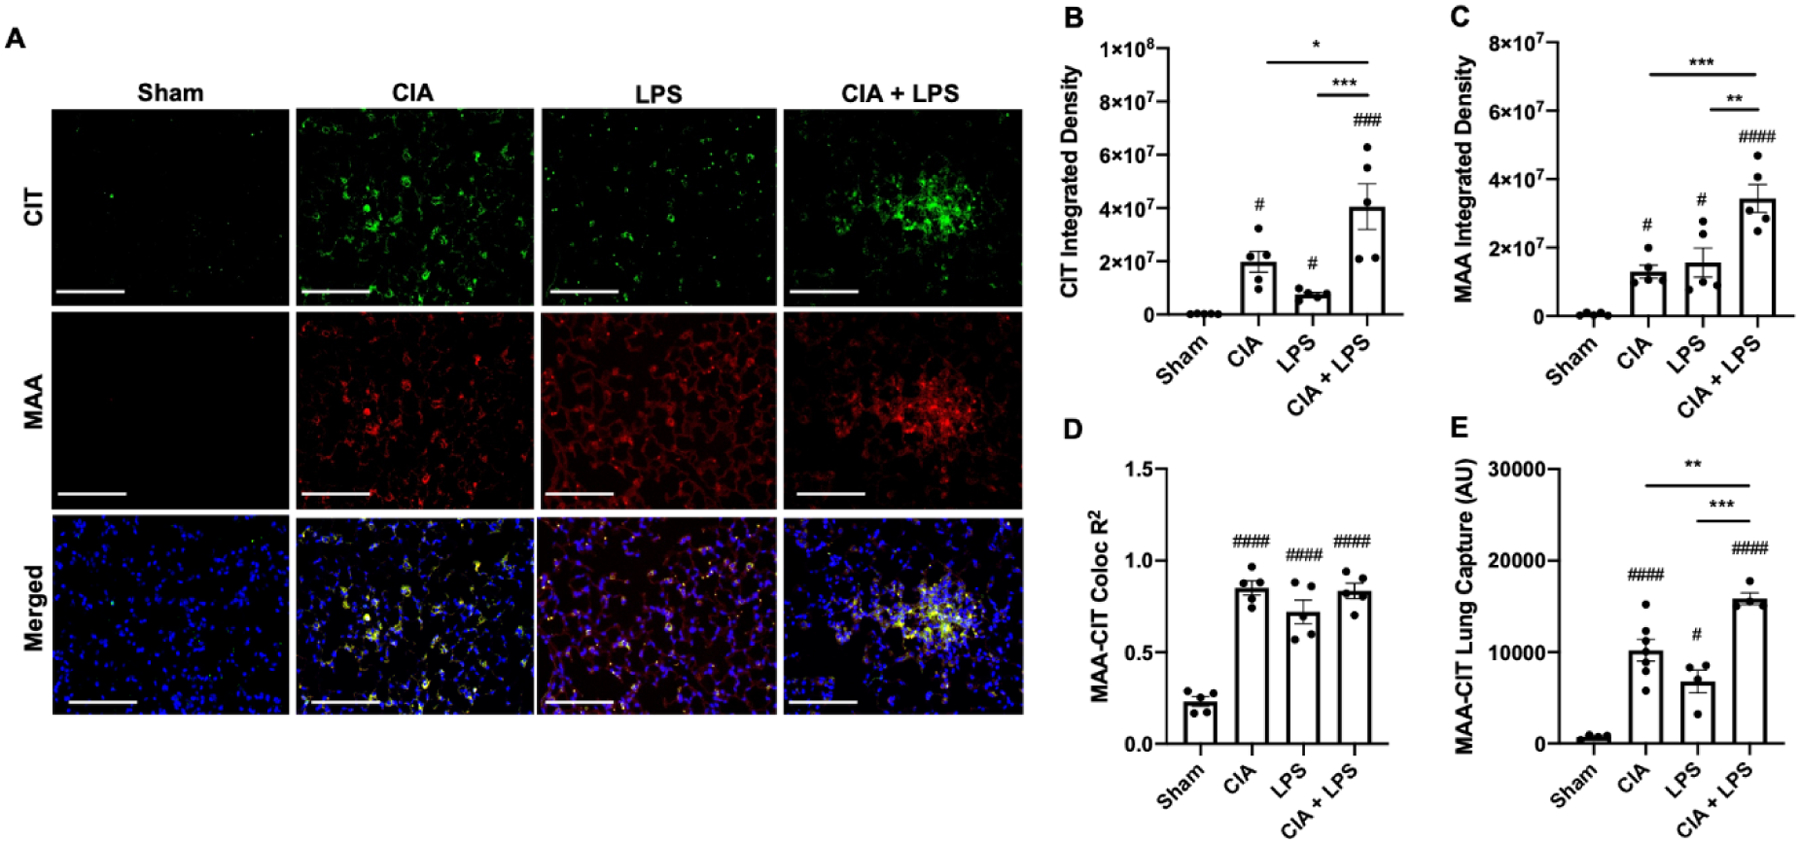
Fig. 2. Combined CIA+LPS modeling modulates lung CIT and MAA autoantigen expression.

(A) Confocal images of lung tissue from treatment groups stained for citrulline (CIT; green) and malondialdehyde-acetaldehyde (MAA; red) modified proteins and merged with nuclei staining (DAPI, blue) shown at 40x magnification. Images were analyzed using Zen 2012 software (Zeiss). Scatter plots depict integrated density with SE bars of (B) CIT and (C) MAA-modified proteins quantified per each mouse. (D) R2-values demonstrating co-localization of MAA-CIT within each treatment group. (E) Co-capture of MAA-CIT from lung tissue homogenates by sandwich ELISA (AU; arbitrary units). Statistical difference versus sham (#p<0.05, ###p<0.001, ####p<0.0001) and between groups as noted by lines (*p<0.05, **p<0.01, ***p<0.001). Line scale denotes 100 μm.
