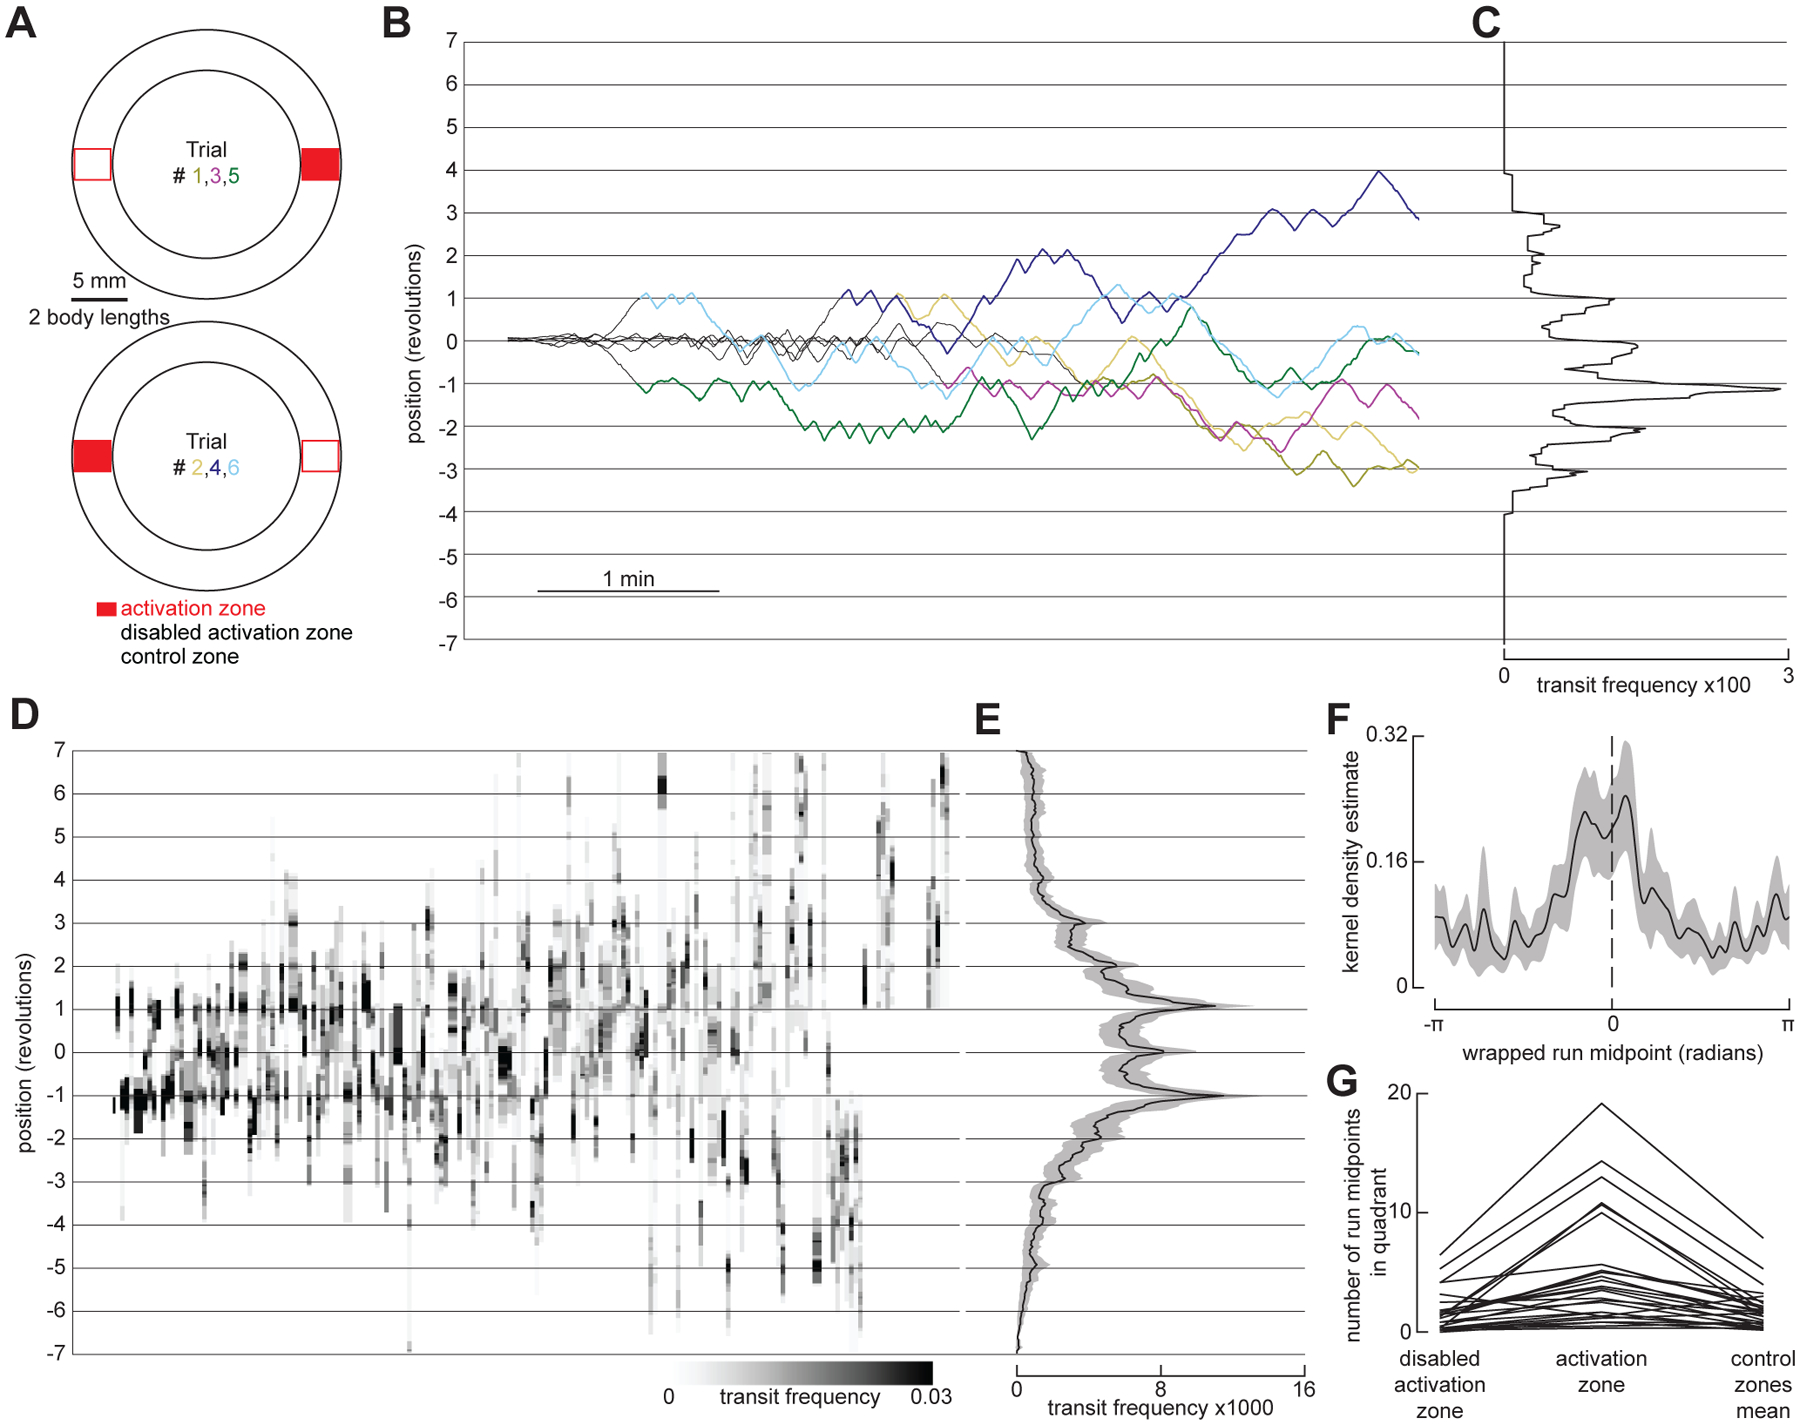
Figure 2. Flies reinitiate a local search at a former fictive food site after circling the arena.

(A) Schematic of the smaller annular arena (~26 body lengths), indicating the location of the food zone for each trial, as well as control zones used for analysis. Experiments were done as in Figure 1C, but each food zone was 1.3 body lengths, and the food zone location was alternated from trial to trial.
(B) Example pre-return (before the fly has circled the arena at least once during the post-AP, grey) and post-return (colored) trajectories from a single experiment where each line corresponds to a single trial and shows the unwrapped trajectory, with gridlines indicating full revolutions around the arena. To align data for analysis, trajectories from even-numbered trials were shifted such that the location of the food zone is always at 0. See also Video S2. For the model recapitulating fly re-initiation of local search at a former fictive food site after circling the arena, see Figure S4 and Video S5.
(C) Mean distribution of fly transits for post-return trajectories in (B). Transits were calculated using bins 2 BL wide and counted when a fly entered a bin from one side and exited the bin from the other side.
(D) Heatmap indicating distribution of transits during post-return trajectories, calculated using 4 bins per revolution (dividing the arena into quadrants centered on the food zone, disabled food zone, and each control zone). Each column represents a single trial, with columns sorted by frequency of transits at the 1 or −1 revolution position. (N = 28 flies, n = 168 trials).
(E) Mean transit distribution for data in (D).
(F) Normalized kernel density estimate (KDE) of the wrapped run midpoint in the post-return period. (N = 28 flies).
(G) Number of run midpoints in each arena quadrant during post-return trajectories. (N = 28 flies). Each line shows the values for a single fly, where data from both control quadrants were averaged together.
