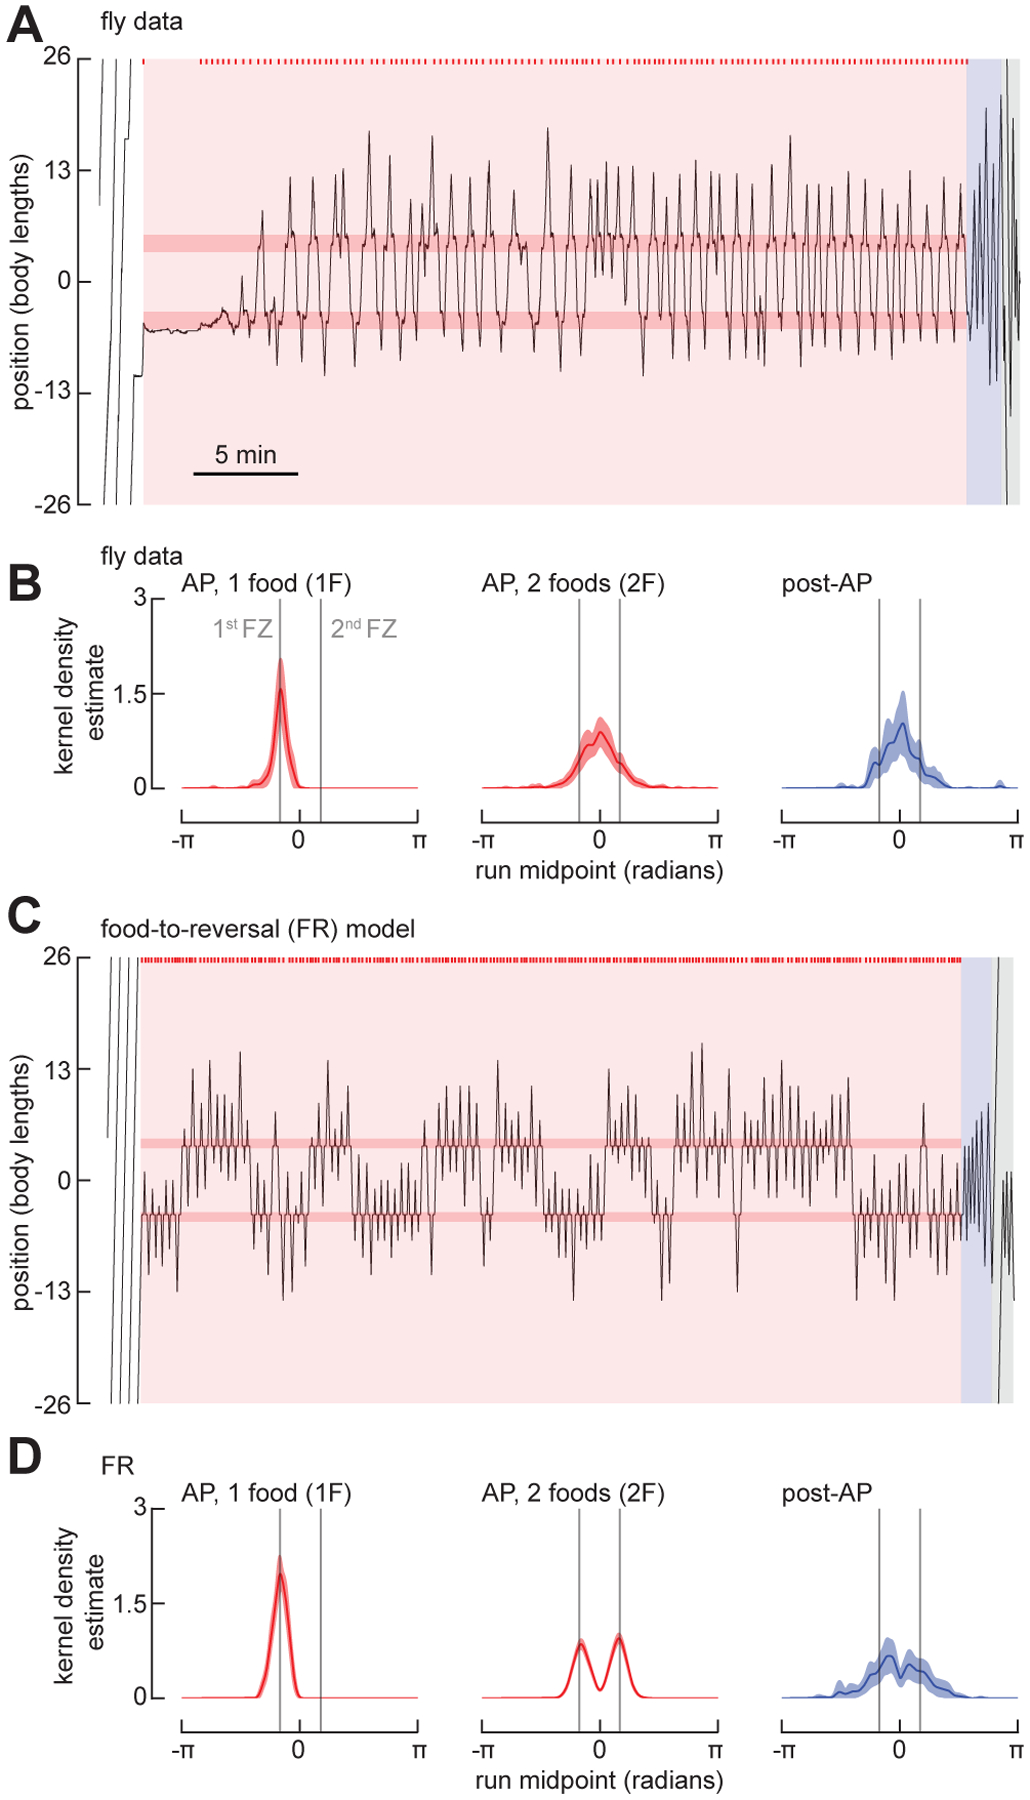
Figure 4. The FR model fails to predict Drosophila search behavior around multiple fictive food sites.

(A) Example trajectory of a fly exploring an annular arena with two food zones, spaced 9 body lengths (BL) apart. The experiment consists of a baseline period, AP, and post-AP. Plotting conventions as in Figure 1B. See also Figure S1C and Video S3. For trajectories of flies exploring an annular arena with two food zones, spaced 13 body lengths (BL) apart, see Figure S1D.
(B) Normalized KDE of the run midpoint for one-food search (1F, left), the two-food search (trajectory after the fly has encountered the 2nd food zone, 2F, middle), and the post-AP (right). To align data for analysis for 1F, trajectories for flies that found the food located at +4.5 BL first were shifted such that the first food for all flies is −4.5 BL. (N = 29 flies).
(C) As in (A), for a simulation using the FR model.
(D) As in (B) for the FR model. The first 300 simulations in which the virtual fly found both food sites are included. (N = 300).
See also Video S3.
