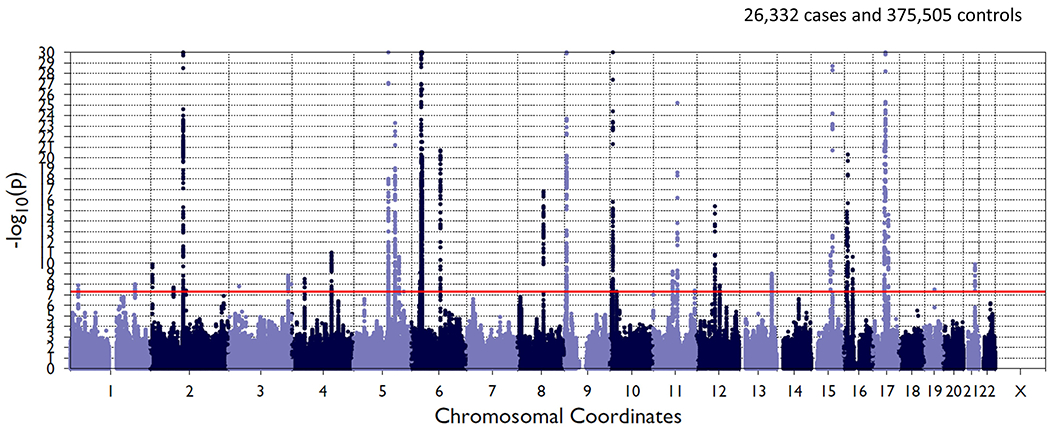
Figure 3. Asthma GWAS Meta-analysis Results for TAGC and UK Biobank Populations.

Manhattan plot of meta-analysis results is shown with chromosal position along the abscissa and −log(p-value) on the ordinate axis. Red horizontal line indicates the significance threshold for genome-wide significance.
