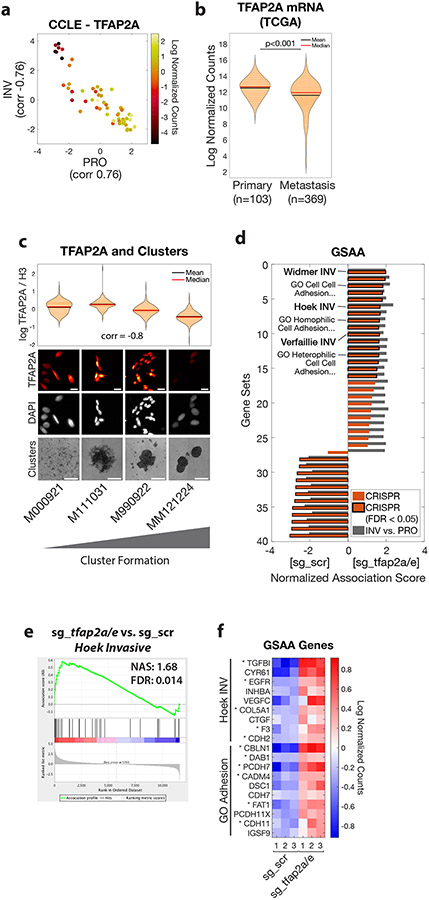
Figure 5. TFAP2 correlates with clustering in human melanoma and regulates genes associated with metastasis and cell-cell adhesion.
a. Human melanoma cell lines in the Cancer Cell Line Encyclopedia (CCLE, n=56) plotted as PRO and INV scores (Hoek et al., 2006) and colored according to TFAP2A mRNA expression. Pearson correlation coefficients between TFAP2A and PRO/INV scores are shown on axes. b. TFAP2A mRNA expression in The Cancer Genome Atlas (TCGA) melanoma (SKCM) cohort comparing primary tumors and metastases (p<0.001 by Wilcoxon rank sum test with Bonferroni correction). c. Low-passage human melanoma cell lines ranked by increased cluster forming ability (left to right) with TFAP2A expression quantified by immunofluorescence (plot and top; Spearman correlation shown; scale bar 20 μm) and clustering (bottom, scale bar 500 μm). d. GSAA was run using gene sets and GO gene sets with FDR < 0.05 from INV vs. PRO RNA-seq (n=39 gene sets; cyan points in Figures 1d and 2a). Bars show Normalized Association Score (NAS) for CRISPR (ZMEL1-PRO sg_tfap2a/e vs. sg_scr) and INV vs. PRO for each gene set, with black outline representing FDR<0.05 for CRISPR experiment. e. Plot of INV signature (Hoek et al., 2006) by GSAA for ZMEL1-PRO sg_tfap2a/e vs. sg_scr RNA-seq. f. Heatmap of top genes in Hoek INV and GO Adhesion gene sets that are differentially expressed between ZMEL1-PRO sg_tfap2a/e and sg_scr (log2 fold change cutoff ± 0.5, padj < 0.05). Asterisks (*) indicate genes with associated TFAP2A CUT&RUN peaks. Human ortholog gene names are used for clarity (see Figure S5p for zebrafish gene names). See also Figure S5 and Tables S4,S5,S6.

