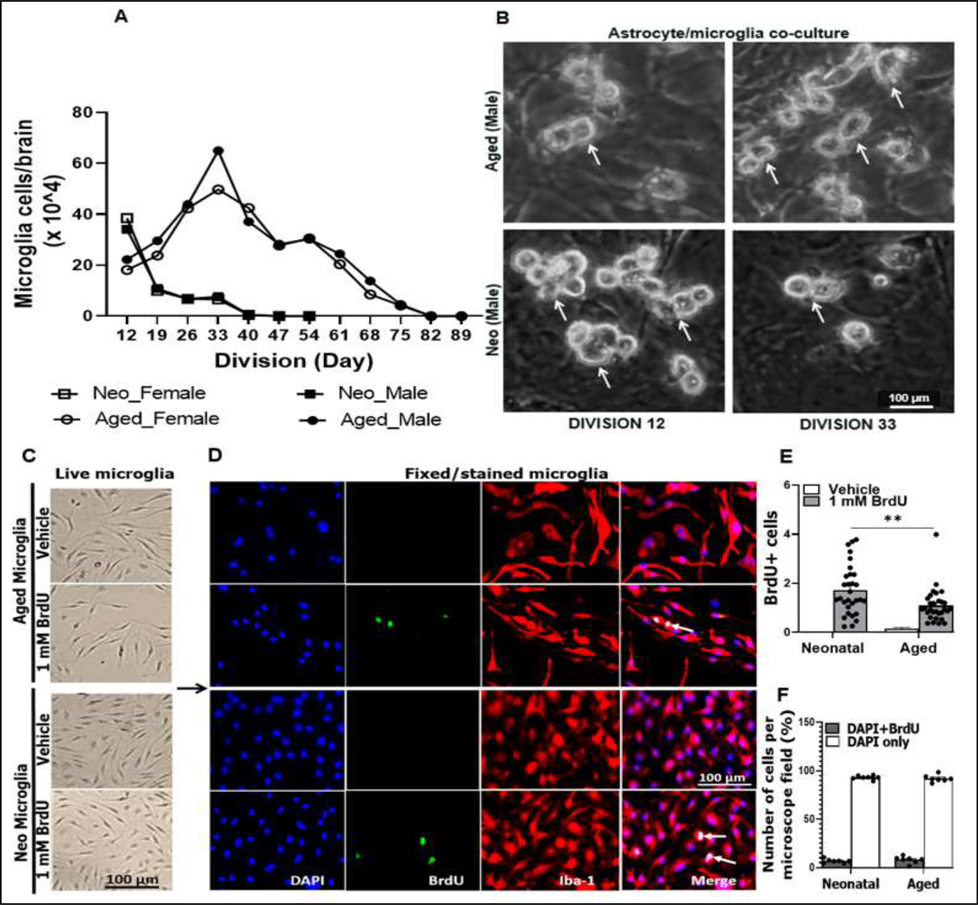
Figure 2.
Division, yield, and proliferation of microglia. (A) Division curve showing average microglial cells per brain/sex, counted by trypan blue exclusion. (B) Representative images of live aged and neonatal (neo) microglia grown on the astrocyte feeder layer. (C) Representative live microglia rested for 48 h following dissociation from astrocyte/microglia co-culture, and then were treated with 1 mM BrdU. (D) Representative fixed/stained microglia for BrdU and Iba1. (E) Quantified BrdU+ cells. (F) Percentage DAPI+BrdU+ (proliferating) vs. DAPI+ only (non-proliferating) cells. White arrows (Fig. 2B) point to mature microglia (ready to dissociate), and white arrows in Fig. 2D point to cells with nuclei incorporating BrdU (proliferating cells). N = 12 flasks each containing cells from 3 neo-brains, and n = 18 flasks each containing cells from 2 aged-brains (Fig. 2A&B). Quantified data for BrdU (Fig. 2E) are from 10 microscope fields and 3 independent experiments. Data of Fig. 2F are from 2–3 microscope fields and 3 independent experiments. **P = 0.0012, (2way ANOVA with Sidak’s multiple comparison’s test).

