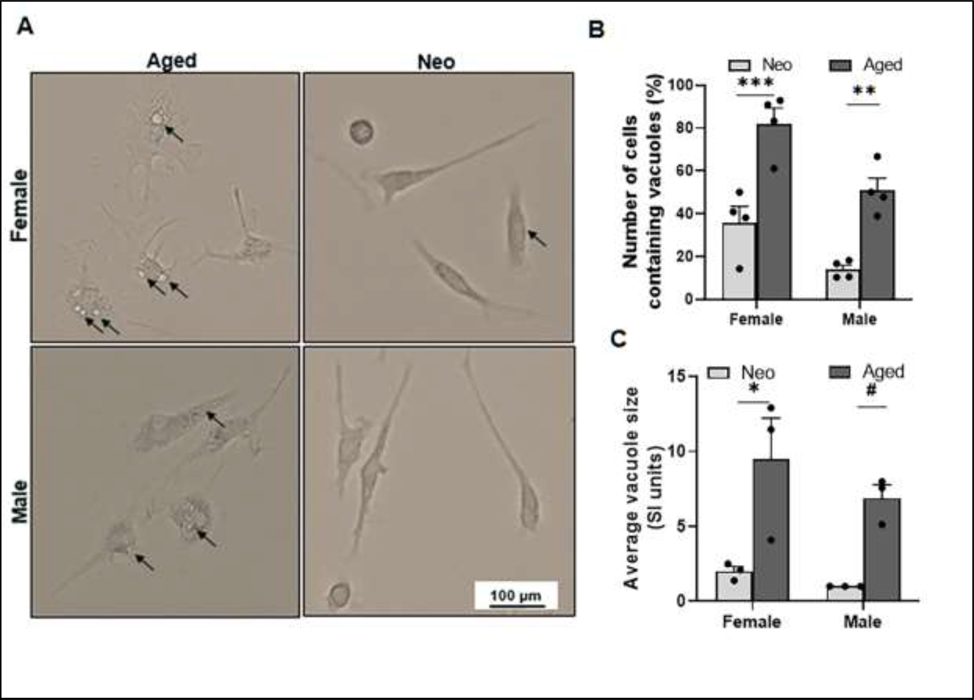
Figure 3.
Aged microglia exhibit bigger cell bodies and more/larger cytoplasmic inclusions than neo microglia. (A) Representative EVOS FL Auto 2 light microscope images at 20x showing vacuoles (inclusions) in the cell cytoplasm (dark arrows). (B) Percentage of vacuolated cell numbers in total neo or aged microglia. Cells per microscopic field were counted using ImageJ software. (C) Average vacuole size in microglia. N = 15–20 cells per microscopy field of independent experiments; *P = 0.0127, **P = 0.0021, ***P = 0.0003, #P = 0.0403 (2way ANOVA with Sidak’s multiple comparison’s test).

