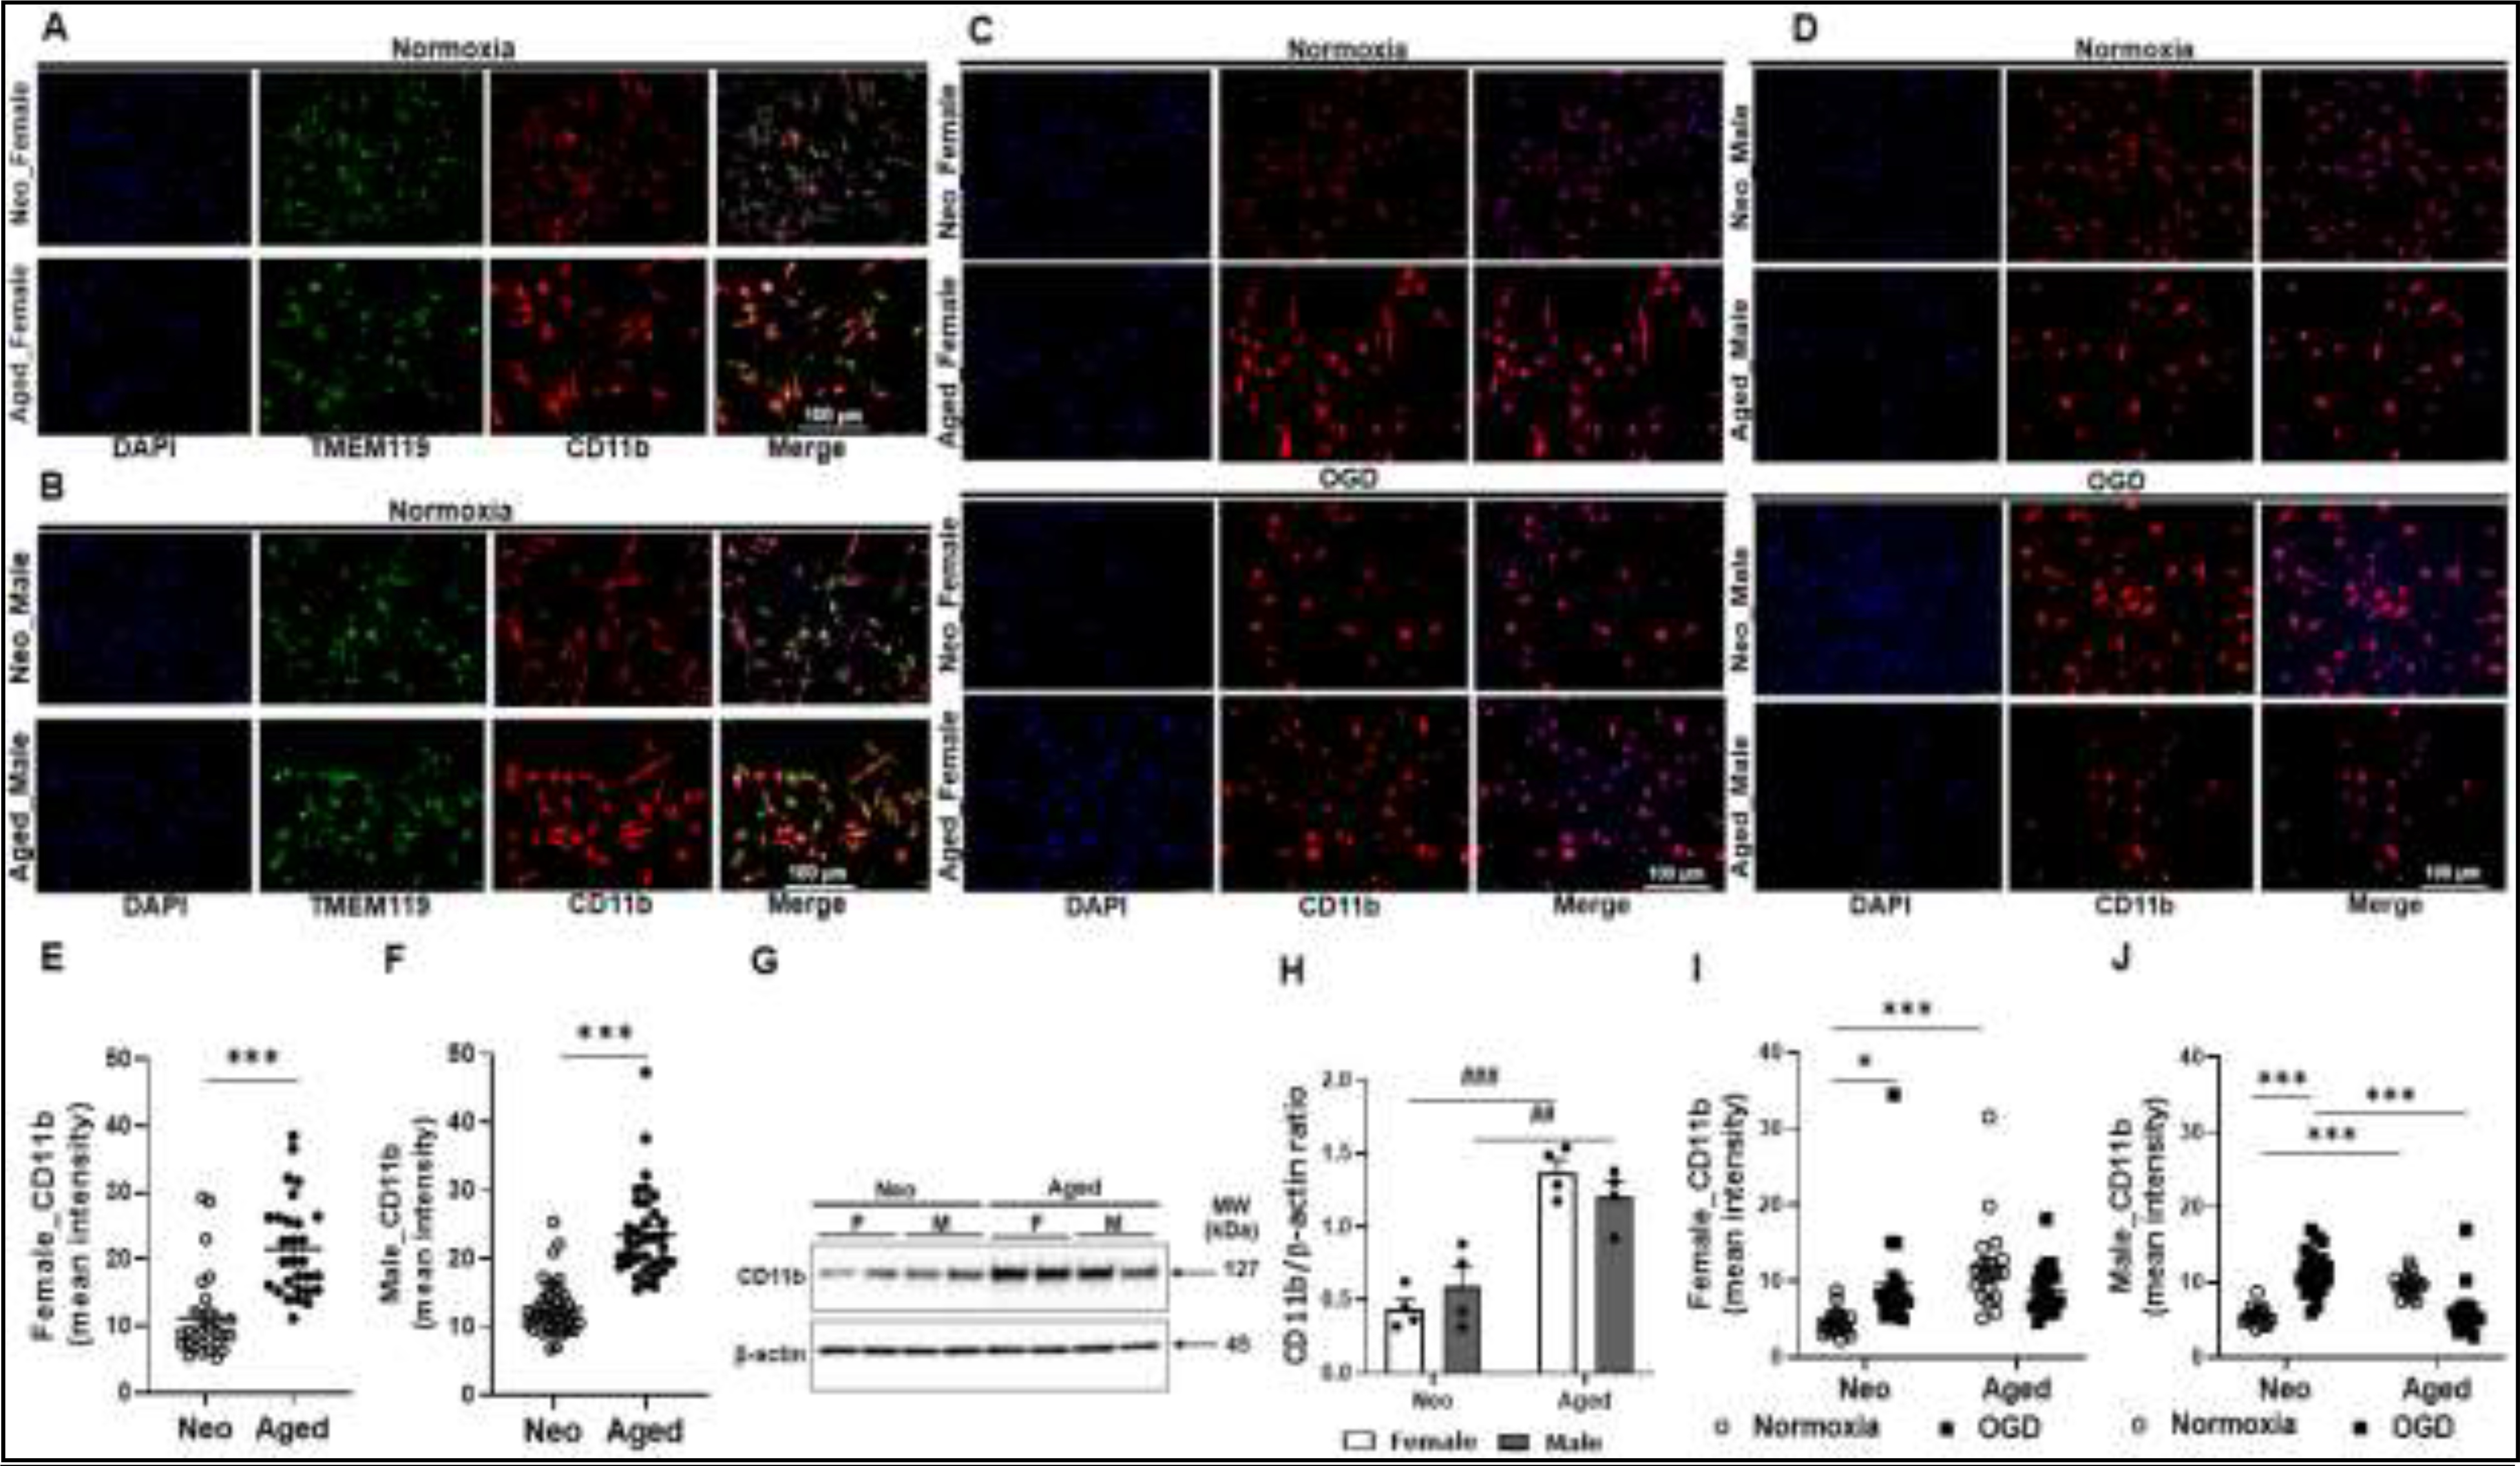
Figure 6.

CD11b and TMEM119 expression in neo and aged microglia. (A, B) Normoxic female (A) and male (B) neo/aged microglia were stained for CD11b/TMEM119 expression. (C) Female neo/aged microglia exposed to OGD vs. normoxia were stained for CD11b. (D) Male neo/aged microglia exposed to OGD vs. normoxia were stained for CD11b. (E, F) ImageJ quatification of CD11b intensity in (A) and (B) respectively. (G) Representative Western blot for CD11b expression in normoxic neo/aged microglia. (H) Optical density ratio of CD11b over β-actin from Western blots in (G). (I, J) ImageJ quantification of CD11b intensity in (C) and (D) respectively. Western blot data were from four independent experiments conducted per sex/age. For ICC, 25–50 cells in a microscopy field were quantified using ImageJ for CD11b expression. ***P < 0.0001 (unpaired two-tailed t test); *P = 0.0101, ***P < 0.0001, ##P = 0.0058, ###P = 0.0001 (two-way ANOVA with Sidak’s multiple comparison’s test).
