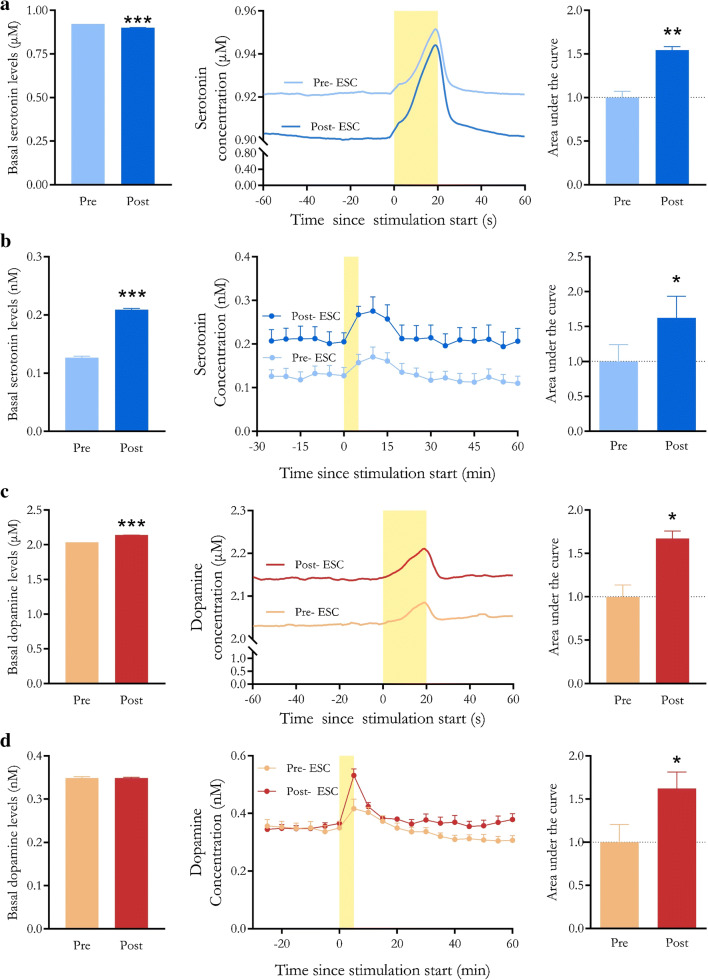
Fig. 5.
Responses to the selective serotonin reuptake inhibitor escitalopram by rapid pulse voltammetry with partial least squares regression analysis (RPV-PLSR) vs. microdialysis. Time courses are shown in the center panels for serotonin determined by aRPV-PLSR or b microdialysis and dopamine by cRPV-PLSR or d microdialysis. Escitalopram (20 mg/kg) was administered subcutaneously at t = −60 min for RPV-PLSR or perfused continuously into the dorsal striatum (10 μM) for microdialysis beginning at t = −90 min. Optical stimulation of Chrimson-transfected dopamine neurons occurred during the time periods marked by yellow bars. Basal serotonin or dopamine concentrations before and after/during escitalopram administration are shown in the left bar graphs. Stimulation-induced increases in serotonin or dopamine before vs. after/during escitalopram are shown in the right bar graphs and are calculated as areas under the curve. *P < 0.05, **P < 0.01, and ***P < 0.001 (see Table S1 and Methods for statistical details)

