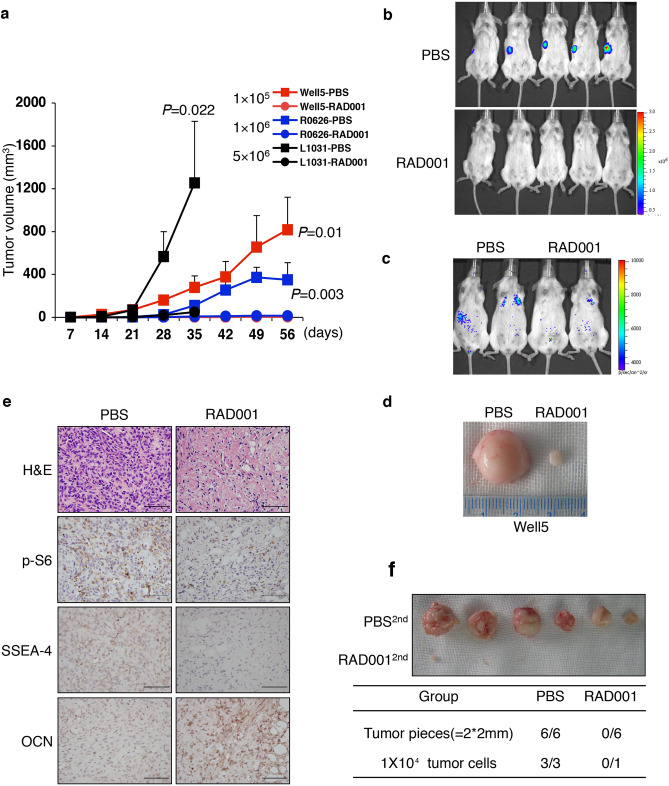
Figure 6.
Terminal differentiation induction by mTOR-inactivation decreases SSEA-4+ TICs in vivo. (a) SSEA-4+ cells (1–50 × 105) from the different resources as indicated were subcutaneously inoculated into NOD/SCID mice. The oral administration of PBS (filled box) or 5 mg/kg RAD001 (filled circle) commenced 2 days later. Tumor volumes are shown as the means ± SDs, n = 3–5. (b, c) Representative images of whole-body (b) or lung metastasis (c) bioluminescence 4 weeks following subcutaneous (b) or tail vein injection (c) of 1 × 10⁵ PBS- or RAD001-treated SSEA-4+ Well5 cells (as in (a)) into NOD/SCID mice. (d) Two representative tissue samples retrieved from the PBS-treated and RAD001-treated groups, respectively. (e) Immunohistochemical staining of p-S6, SSEA-4, or OCN in xenografts retrieved from the PBS-or RAD001-treated group, as in (a, b). Scale bars represent 100 μm. HE: hematoxylin–eosin. (f) Secondary tumorigenic xenograft formation of tumor tissue or cells after post-PBS or -RAD001 treatment, as in (a, b) (upper panel). Secondary tumorigenic xenografting rates (n/n) are summarized in the bottom table (P < 0.01).

