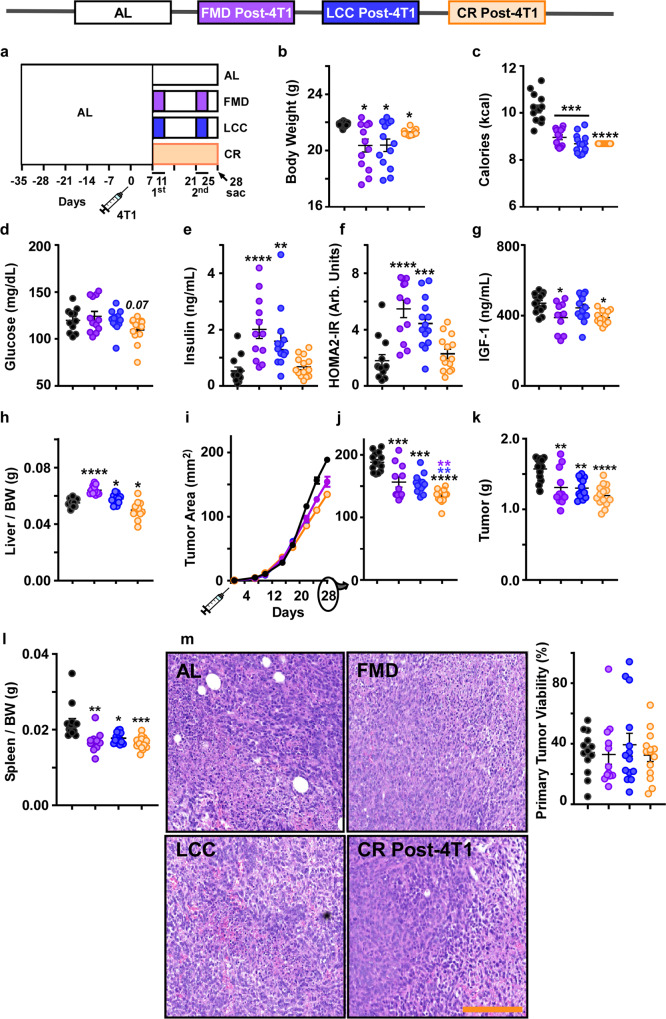
Fig. 2. Daily CR provides greater protection against primary tumor growth than caloric cycling when initiated concurrently.
a Experimental Layout. A post-tumor implantation daily CR-fed group was incorporated into the study. All treatment groups were on ad libitum feeding during injection with 4T1 cells (106 cells/mL) at day 0. One week after injection (day 7), mice underwent 2 rounds of caloric cycling (FMD or LCC) or daily CR until tissue collection at day 28. b Average body weight and c average calorie intake throughout the study. d Blood glucose, e serum insulin levels, f the homeostatic model assessment calculation of insulin resistance (HOMA2-IR), and g serum IGF-1 levels collected at day 28. h Liver mass per unit of body weight. i Growth rates of the primary tumor. j Primary tumor area at day 28. k Tumor mass and l spleen mass per unit of body weight. m Representative images of H&E staining of primary tumors, including both viable and necrotic areas, under different experimental conditions [original magnification ×200] and histological quantification of tumor viability. Scale bar = 100 μm. Most of the data are represented as scatter plots with mean values ± SEM. One-way ANOVA with Tukey post hoc analysis was used to determine statistical significance with *p < 0.05, **p < 0.01, ***p < 0.001, ****p < 0.0001 compared to AL (black), FMD (purple), or LCC (blue). b, c, h–m AL n = 13; FMD, n = 12; LCC, n = 13; CR, n = 13. d-f AL, n = 12; FMD, n = 12; LCC, n = 13; CR, n = 13. g AL n = 13; FMD, n = 10; LCC, n = 13; CR, n = 13 mice per treatment group. Source data are provided as a Source Data file. BW body weight, arb. units arbitrary units.

