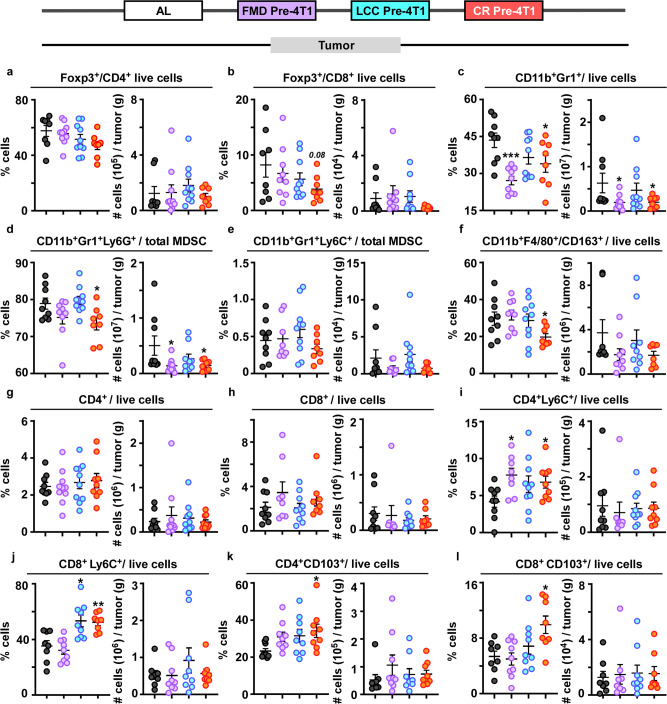
Fig. 7. Immunological remodeling in the tumor microenvironment.
Frequency (%) (left) and cell count per gram of tumor (#) (right) of immune cells identified in the primary tumor collected from mice undergoing dietary regimens initiated prior to 4T1 implantation (Fig. 4). a Foxp3+CD4+ T regulatory cells; b Foxp3+CD8+ T regulatory cells; and c CD11b+Gr1+ cells (MDSCs). MDSC subset detected in the primary tumor, d CD11b+Gr1+Lys6G+ (granulocytic-MDSCs), and e CD11b+Gr1+Lys6C+ (monocytic-MDSCs). f CD11b+F480+CD163+ immunosuppressive cells. g Effector CD4+ and h effector CD8+ cells. i CD4+Lys6C+ cells and j CD8+Lys6C+ cells. k CD4+CD103+ cells and l CD8+CD103+ cells. Scatter plots represent mean values ± SEM. One-way ANOVA with Tukey post hoc analysis was used to determine statistical significance with *p < 0.05, **p < 0.01, ***p < 0.001. a AL, n = 8; FMD pre-4T1, n = 10; LCC pre-4T1, n = 10; CR pre-4T1, n = 8. b AL, n = 8; FMD pre-4T1, n = 9; LCC pre-4T1, n = 10; CR pre-4T1, n = 8. c, d, f AL, n = 9; FMD pre-4T1, n = 9; LCC pre-4T1, n = 10; CR pre-4T1, n = 8. e AL, n = 9; FMD pre-4T1, n = 8; LCC pre-4T1, n = 10; CR pre-4T1, n = 8. g AL, n = 9; FMD pre-4T1, n = 10; LCC pre-4T1, n = 10; CR pre-4T1, n = 9. h AL, n = 9; FMD pre-4T1, n = 8; LCC pre-4T1, n = 10; CR pre-4T1, n = 8. i AL, n = 9; FMD pre-4T1, n = 8; LCC pre-4T1, n = 10; CR pre-4T1, n = 9. j, l AL, n = 8; FMD pre-4T1, n = 9; LCC pre-4T1, n = 9; CR pre-4T1, n = 8. k AL, n = 9; FMD pre-4T1, n = 9; LCC pre-4T1, n = 9; CR pre-4T1, n = 9 mice per treatment group. Source data are provided as a Source Data file.

