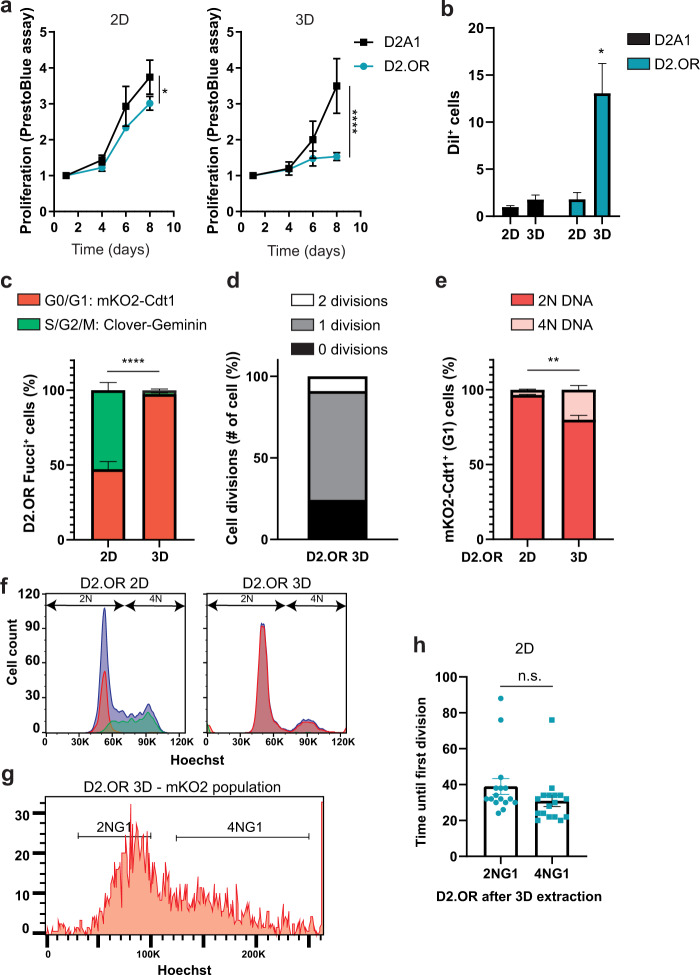
Fig. 2. Characterization of D2.OR G1 cell cycle arrest in 3D culture.
a Proliferation analysis of D2A1 and D2.OR cells in 2D or 3D culture conditions using PrestoBlue cell viability assay. N = 3 replicates in duplo/triplo. 2D graph: interaction effect, F (3,42) = 3.685, P = *. 3D graph: interaction effect, F (3,42) = 10.57, P = ****. b Quantification of the percentage of DiI+ cells after eight days of culture by FACS. N = 3 repeats. Interaction effect, F(1,6) = 6.278, P = *; post hoc test, D2OR 3D vs all others, P = *. c Quantification of the percentage of Fucci+ cells (either Clover+ or mKO2+) after three days of culture by FACS. N = 3 repeats. d Quantification of the number of cell divisions until cells remained in G1 (mKO2 + ) after plating in Matrigel. Cells were imaged every 3 h. N = 5 positions, 13 cells. e Quantification of FACS analysis showing the percentage of mKO2+ D2.OR Fucci+ cells containing 2 N or 4 N DNA (measured by Hoechst) in 2D or 3D after three days of culture, N = 3. f FACS plot of experiment quantified in c and e. Blue: Hoechst, Green: Clover–Geminin, Red: mKO2–Cdt1. g FACS plot of D2.OR-FUCCI4 cells incubated with Hoechst and extracted from 3D and sorted according to strategy as displayed in supplementary Fig. 6c. The mKO2+ cells are shown in a histogram with Hoechst (DNA) on the X axis to show the cell cycle profile. Representative image from N = 3. h Quantification of the time until the first division of sorted D2.OR cells extracted from 3D Matrigel. The population is based on gates shown in g. Quantification of a representative experiment of N = 3. P values were calculated using a repeated measures 2-way ANOVA or t-test. Error bars, s.e.m.

