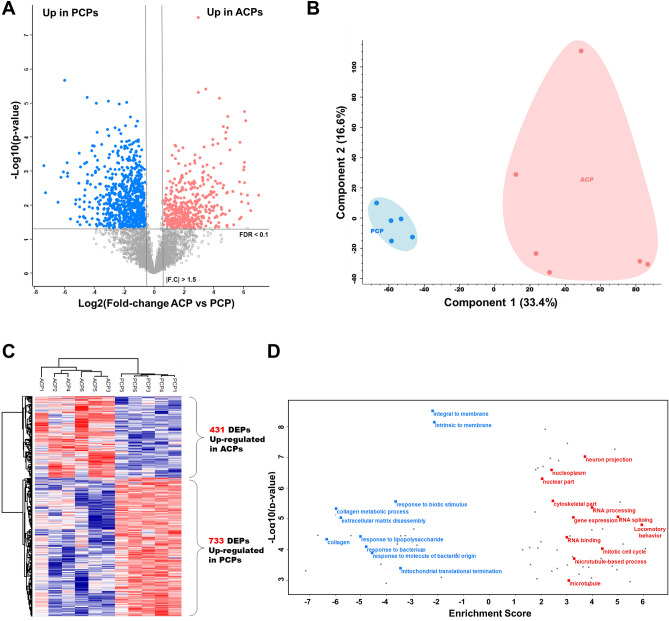
Figure 2.
Results of the label-free quantification approach. (A) Volcano plot depicts differential expression between two craniopharyngioma subtypes (ACP and PCP) using label-free quantification data. (B) Principal component analysis of the 11-tumor label-free proteomic data. (C) The heatmap represents unsupervised hierarchical clustering of the 11 tumor samples using 923 proteins that were differentially expressed as identified by label-free quantification. (D) Gene ontology (GO) enrichment analysis of the label-free data. The red points indicate upregulated proteins in ACPs, and blue points indicate upregulated proteins in PCPs.

