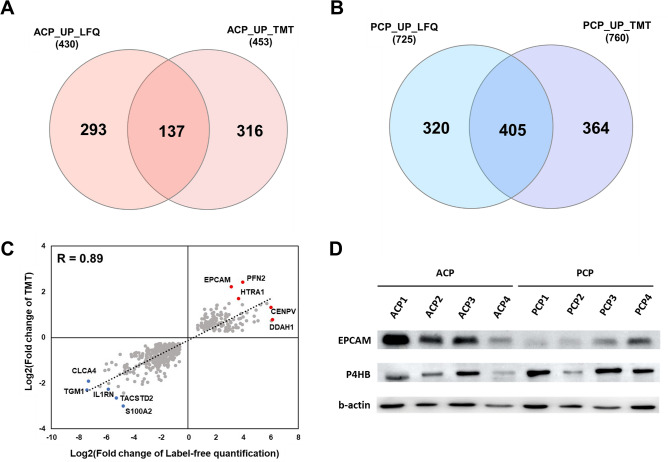
Figure 4.
Comparison between label-free and TMT quantification methods. (A) Venn diagram showing the comparison of differentially upregulated proteins between ACPs in both datasets. (B) Venn diagram showing the comparison of differentially upregulated proteins between PCPs in both datasets. (C) Correlation analysis of fold changes in the label-free and TMT quantification data. (D) Validation of the proteomic data using protein expression. Western blotting was performed to measure EPCAM, P4HB and β-actin.

