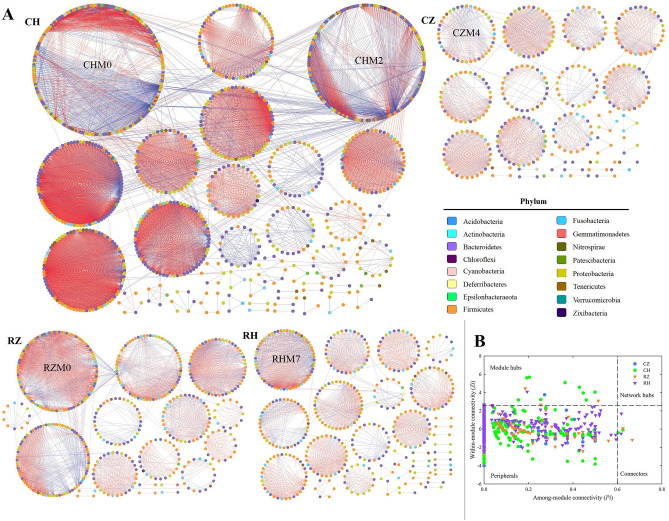
Figure 6.
Ecological networks of intestinal microbiota in the six groups (A). Ecological network graph with submodule structure was obtained using the fast-greedy modularity optimization method. Each node indicates one OTU at the phylum level. Node colors indicate different major phyla. Blue edges indicate a positive interaction between two individual nodes, while red edges indicate a negative interaction. Z-P plot showing the distribution of operational taxonomic units (OTUs) based on their topological roles (B). Species with both a low Zi (value < 2.5) and a low Pi (value < 0.6) were peripheral species, i.e., they had only a few links, and these were almost always only to species within their module. Species with either a high value of Zi (≥ 2.5) or Pi (≥ 0.6) were module hubs, connectors and network hubs, as they were highly connected species linked to many other species within their own module.

