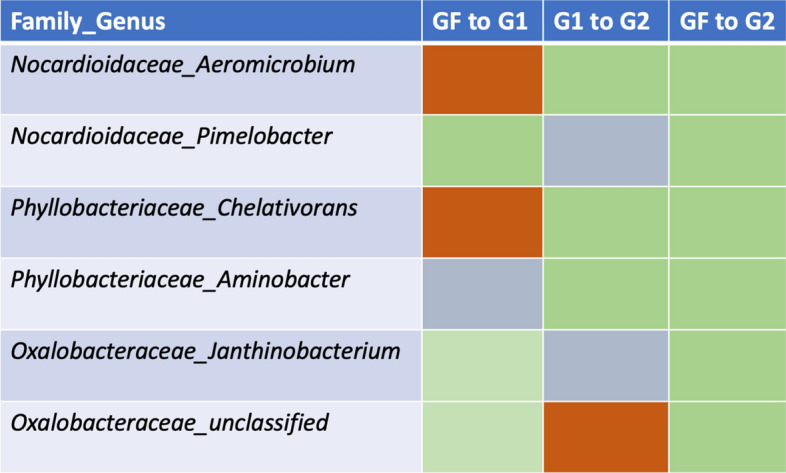
Table 1.
Bacterial taxa, to the genus level, which showed differing abundances when comparing inoculated treatment groups from different generations.

GF signifies microbial community membership from the initial soil slurry used to inoculate the first generation. G1 and G2 represent generation 1 and generation 2, respectively. Green boxes represent a significant increase in abundance and red boxes represent a significant decrease in abundance. Gray boxes represent no significant differences in abundance between the two treatment groups. The two generational treatments used in a comparison are identified at the top of each column.
