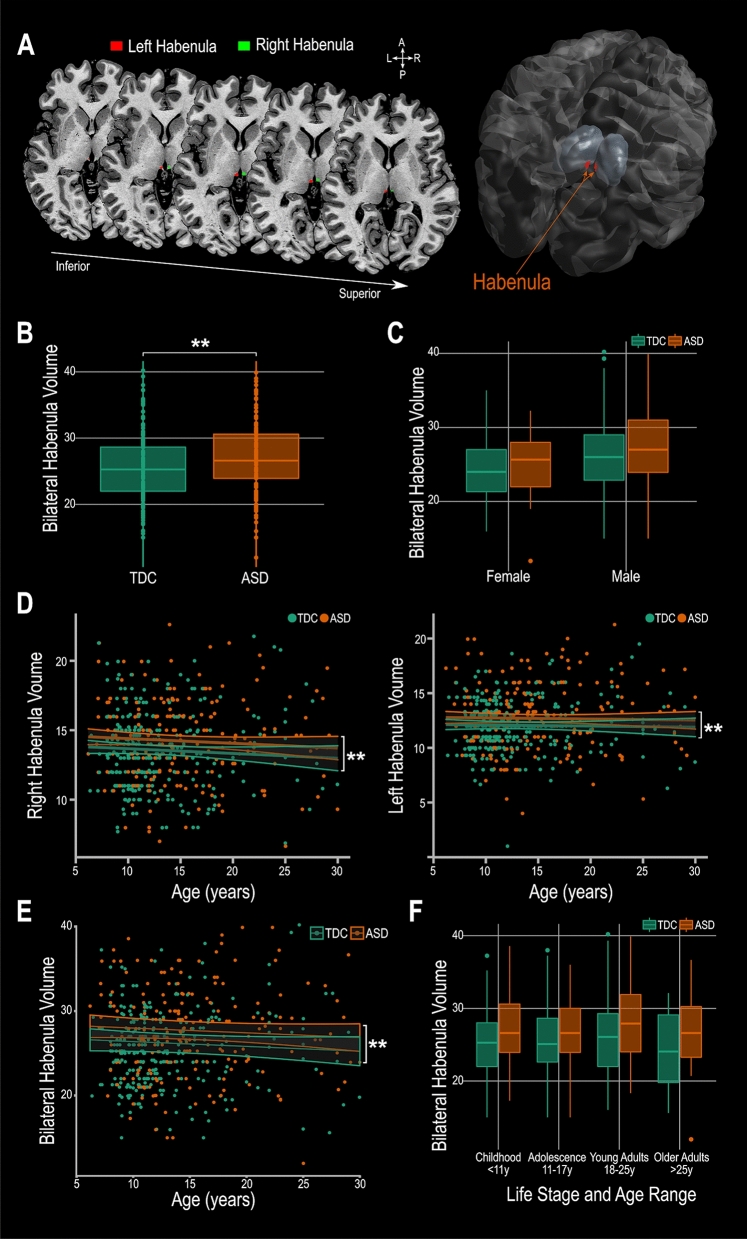
Figure 2.
Habenula volume differences found in ASD. (A) Example MAGeTBrain habenula segmentation on a T1 weighted magnetic resonance image illustrated on the axial plane and 3D reconstruction of the habenula. (B) Bilateral habenula volume is greater in ASD compared to TDC. (C) The group effect (bilateral habenula larger in ASD vs TDC) is independent of sex. (D) There is no effect or laterality; the habenula is larger in ASD compared to TDC in the right and in the left hemisphere. This effect is apparent across the entire age range tested (E) within all age groups (F). ** indicates p ≤ 0.01. ASD: autism spectrum disorder subjects; TDC: typically developing controls.

