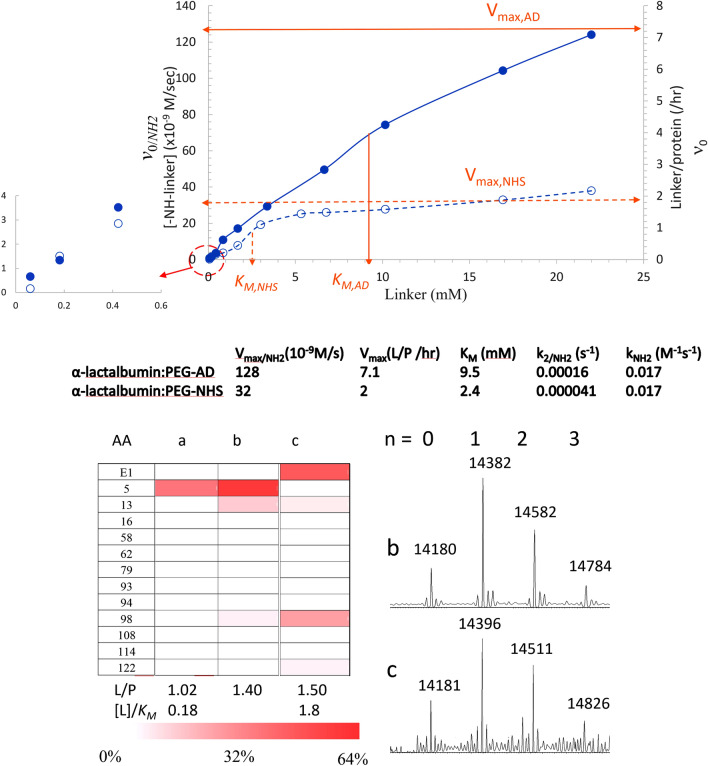
Figure 4.
Comparability study of α-lactalbumin (100 μg). Modified Michaelis–Menten plots (top) for bioconjugation of AD-PEG-N3 (closed) versus NHS-PEG-N3 (open). The determined parameters from the plot were indicated in below. Distribution of the conjugation sites (bottom) obtained by reaction with a: AD-PEG-N3 (1.67 mM) for 1 h, b: AD-PEG-N3 (1.67 mM) for 3 h, and c: NHS-PEG-N3 (4.41 mM) for 1 h. The corresponding intact spectra of b and c were shown in the right.

