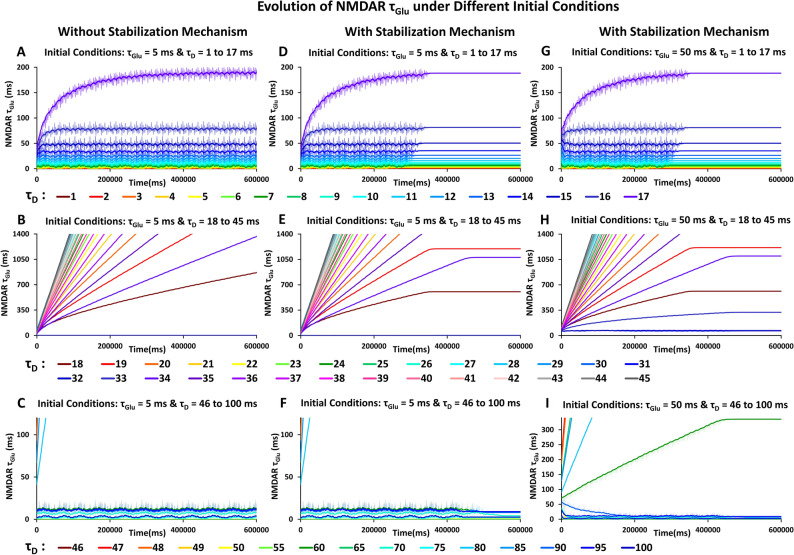
Figure 3.
SITDL simulations with and without stabilization mechanisms, under different sets of initial conditions. Each curve shows the changes in τGlu over time, for a single simulation with the specific initial τD value indicated by the color of the curve. (A) Changes in τGlu when starting with τGlu = 5 ms and different initial τD value for each curve, ranging from 1 to 17 ms. By 600,000 ms simulation time, each curve appears to reach more stable values. (B) Changes in τGlu with initial conditions τGlu = 5 ms and τD value ranging from 18 to 45 ms. In most cases, τGlu increases, but there does not appear to be sufficient simulation time for it to reach more stable values as in (A). (C) Changes in τGlu with initial conditions τGlu = 5 ms and τD value ranging from 46 to 100 ms, which provide much less overlap of glutamate and voltage signals. Certain τD values, such as 49 to 60 ms, 70 to 75 ms, and 90 to 100 ms, seem to provide sufficient overlap for τGlu to change significantly and potentially achieve coincidence of gate conductances with enough simulation time. (D–F) Same simulations and initial conditions as in Fig. 4A–C, but with stabilization mechanisms, which cause τGlu to stop changing when there is sufficient overall NMDAR conductance. Note, τGlu stabilization generally occurs more quickly for smaller τD, and even at high τD (18 to 100 ms), τGlu still stabilizes for certain values at the end of the simulation, despite limited overlap of the periodic signals. (G–I) Same simulations with stability mechanisms as in Figure (D–F), except with initial τGlu = 50 ms.

