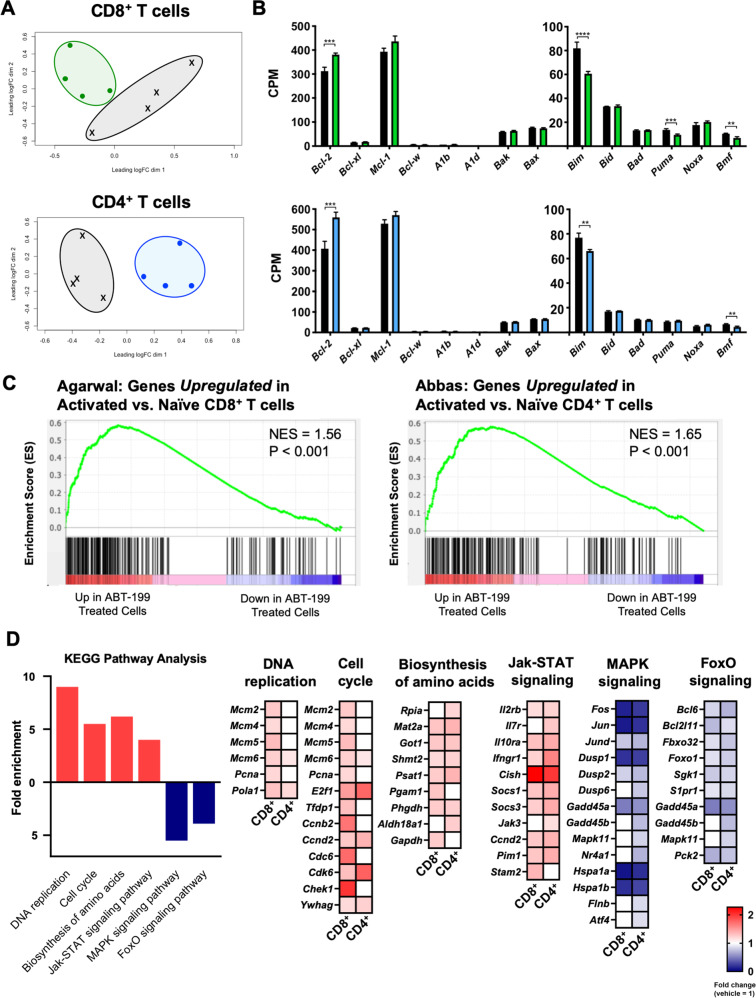
Fig. 7. Long-term BCL-2 blockade leads to changes in BCL-2 family transcripts and upregulation of genes consistent with an activated phenotype.
Mice were treated as described in Fig. 5 and naïve CD8+ and CD4+ T cells were collected for RNA-sequencing one day following the last dose of venetoclax. A Multidimensional principle component analysis of gene expression from CD8+ and CD4+ isolated from venetoclax-treated (green and blue areas respectively) compared to vehicle-treated controls (black areas). B Counts per million reads (CPM) of the BCL-2 family genes, separated by multidomain anti-/pro-apoptotic and BH3-only proteins. C Gene set enrichment data of RNA-sequencing data performed using the ‘Immunological Signatures’ collection in the Molecular Signatures Database. Gene sets used were: GSE15930 for CD8+ T cell analysis [68] and GSE22886 for CD4+ T cell analysis [3]. D Transcriptional profiles of CD8+ and CD4+ T cells by KEGG pathway analysis of significantly upregulated (red) and downregulated (blue) genes (p < 0.01). For all pathways enriched, individual genes are displayed in heatmap arrays according to fold change in expression normalized to vehicle with additional comparison between CD8+ and CD4+ T cells within each panel. n = 4 mice/group. *p < 0.05, **p < 0.01, ***p < 0.001, ****p < 0.0001.

