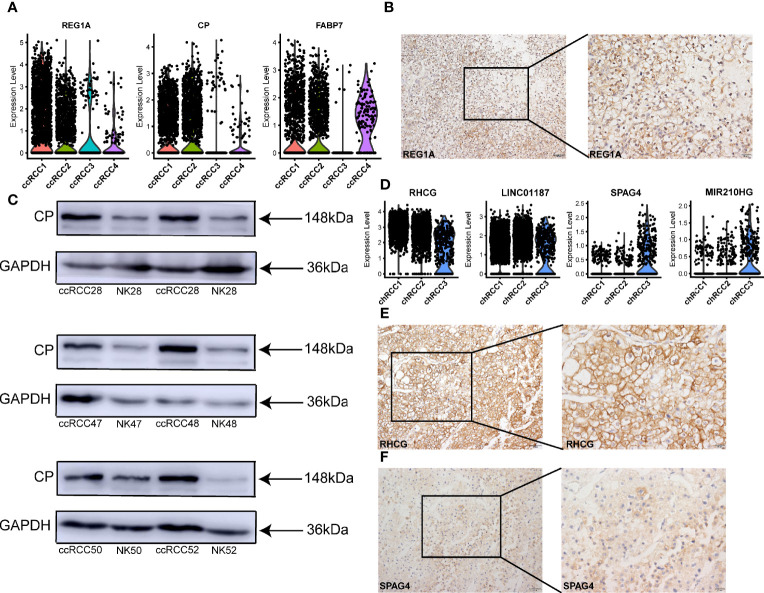
Figure 4.
Tumor-specific markers in different types of ccRCC and chRCC. (A) Violin plots showing tumor-specific markers expressed in ccRCC. (B) IHC-P verification of tumor-specific marker REG1A in ccRCC. Scale bars, 20 μm (left) and 50 μm (right). (C) Western blot was performed showing the expression of CP protein in different ccRCC tissues ( Table S10 ) and normal kidney (NK). (D) Violin plots showing tumor-specific markers expressed in chRCC. (E, F) IHC-P verification of tumor-specific markers RHCG and SPAG4 in chRCC ( Table S10 ). Scale bars, 20 μm (left) and 50 μm (right).

