Figure 7.
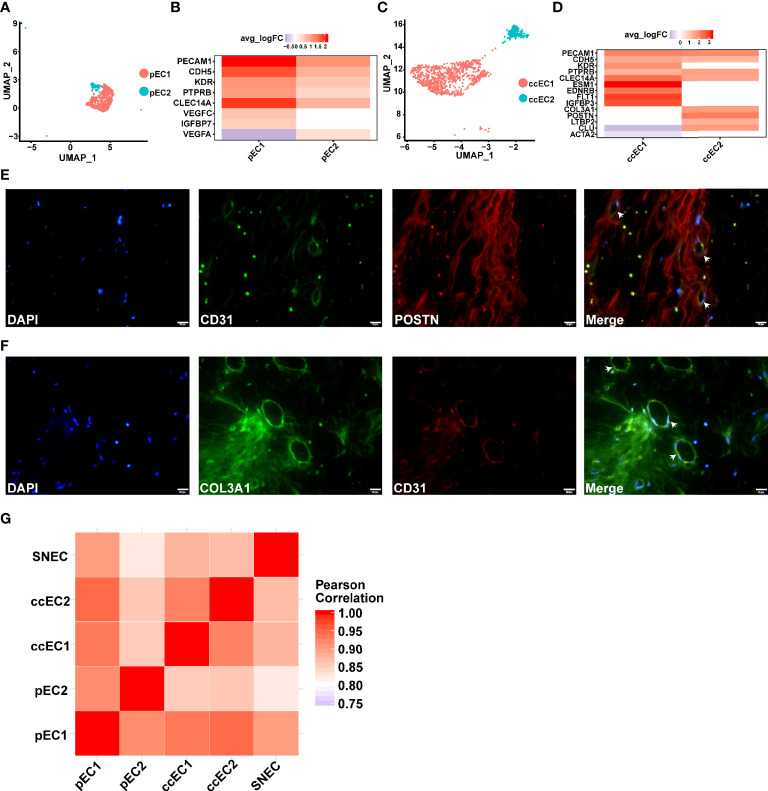
scRNA-seq revealed two subpopulations of ECs in pRCC and ccRCC. (A–D) Two types of endothelial cells discovered in type 2 pRCC and ccRCC, respectively. (A) UMAP plot representation of two types of ECs in type 2 pRCC. (B) DEGs of two types of ECs in type 2 pRCC. (C) UMAP plot representation of two types of ECs in ccRCC. (D) DEGs of two types of ECs in ccRCC. A novel EC type (POSTN+ and COL3A1+) was identified. (E) IF analysis of the expression of CD31 (green), which is an EC marker, in combination with POSTN (red) and DNA staining using DAPI (blue) within the tissue paraffin sections from ccRCC to verify these novel ECs. (F) Another marker, COL3A1 (green), used to verify the same result. Scale bars, 20 mm. (G) Heat map indicating Pearson correlation coefficient on the average gene expression amongst EC population in type 2 pRCC, ccRCC and normal kidney.

