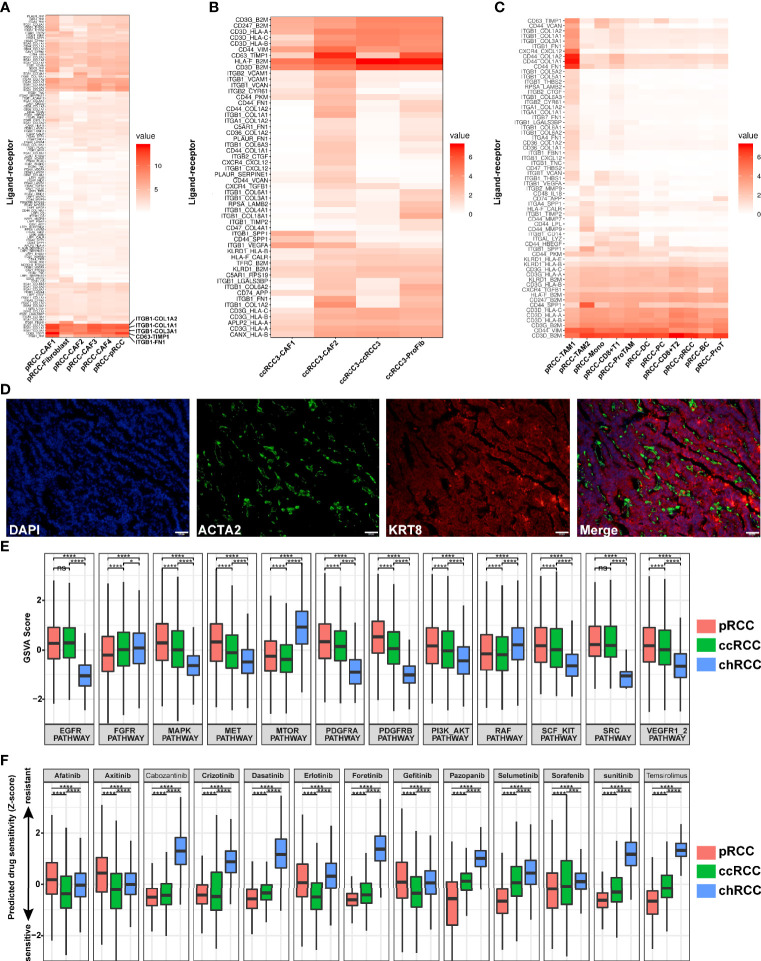
Figure 9.
Ligand–receptor interactions in RCC, prediction of drug target pathways and sensitivity to drug responses. (A) Ligand–receptor interactions in type 2 pRCC and CAFs. (B) Ligand–receptor interactions in ccRCC and CAFs. (C) Ligand–receptor interactions in type 2 pRCC and immune cells. (D) Spatial CAF location verified in type 2 pRCC using the CAF marker ACTA2 (green), epithelial cell marker KRT8 (red) and DNA staining via DAPI (blue) within the tissue paraffin sections from human type 2 pRCC samples. Scale bars, 50 μm. (E) Prediction of activation of drug target pathways. (F) Prediction of activation of drug sensitivity to drug responses. *p < 0.05, ***p < 0.01 and ****p < 0.001.

