Figure 2.
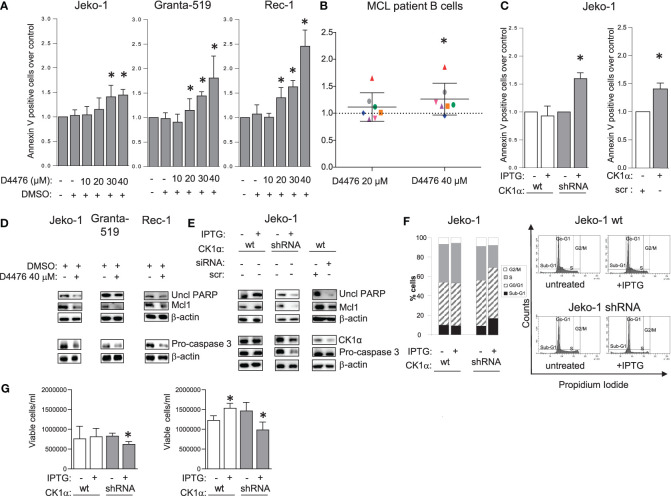
CK1α sustains MCL cell survival and proliferation. Histogram showing annexin V positive cells of MCL cell lines Jeko-1 Granta-519 and Rec-1 (A), 7 independent MCL patients B cells (B) treated with different concentration of D4476 for 48h (A) or 24h (B), Jeko-1 IPTG inducible CSNK1A1 directed shRNA clone (named CK1α shRNA) and Jeko-1 wt treated with IPTG 500µM for 13 days (C left panel) or Jeko-1 cells electroporated with CSNK1A1 directed siRNAs for 48h (C right panel). Data are expressed as mean ± SD of n=3 (A), n=7 (B) n=4 (C left panel) and n=3 (C right panel) independent experiments. * indicates p < 0.05 compared to the untreated cell population. The silencing efficacy and the expression of anti-apoptotic proteins are showed in (D, E) In WB panels, β-actin was used as loading control. Uncl PARP= Uncleaved PARP. (F) cell cycle distribution with PI staining and FACS analysis of the same cells as in (C). Left: bar graph representing the average of four independent experiments of the sub-G1 (black), G0/G1 (striped, gray), S (grey) and G2/M (white) phases of the cell cycle. Right: representative FACS histogram plots. (G) Trypan blue negative (viable) Jeko-1 wt (white bars) and Jeko 1 shRNA cellular clone (grey bars) treated with IPTG 500µM for 6 days (left panel) or 13 days (right panel). Data are expressed as mean ± SD of n=3 experiments (wt and shRNA clone, left panel), n=4 experiments (wt Jeko-1 right panel) and n=8 experiments (Jeko-1 shRNA clone, right panel). * indicates p < 0.05 compared to the corresponding untreated cell population.

