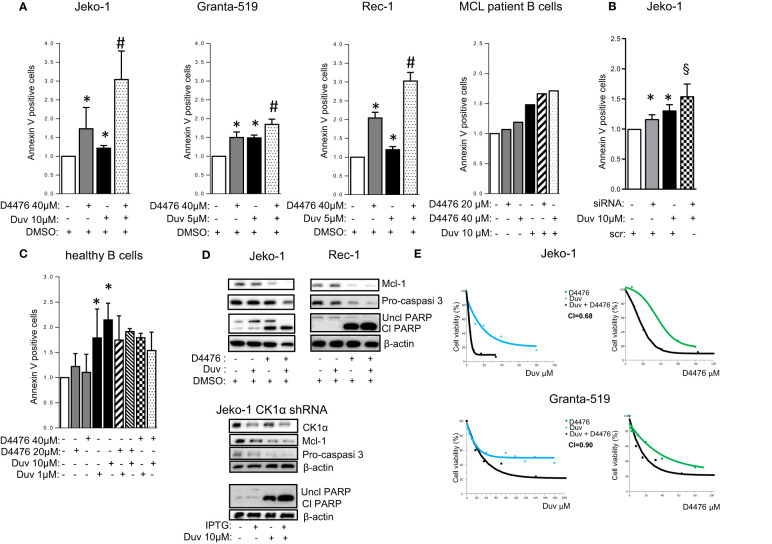
Figure 8.
CK1α inactivation empowers Duvelisib induced cytotoxicity. (A–C) Annexin V staining and FACS analysis of MCL and healthy B cells in which CK1α inactivation was associated with Duvelisib (Duv) treatment. (A), MCL cell lines Jeko-1, Granta-519, Rec-1, were treated with Duv for 48h and with D4476 for the last 24h at the indicated concentrations. Purified B cells derived from 1 MCL patient were treated with Duv and D4476 for 24h. (B) Jeko-1 wt cells were electroporated with CSNK1A1 directed siRNAs for 48h and treated with Duv 10µM alone or in combination with CK1α silencing for the last 24h. (C) Healthy B cells (n=4) were treated with Duv 1µM or 10µM, D4476 20µM or 40µM or the combination of both compounds for 24h. Data represent the mean ± SD of at least n=6 (Jeko-1), n=9 (Granta-519), n=3 (Rec-1) independent experiments normalized over control. * indicates p < 0.05 compared to DMSO treated cells, # indicates p < 0.05 between samples treated with Duvelisib together with D4476 and Duvelisib or D4476 alone; § indicates p < 0.05 between samples treated with Duvelisib together with CK1α silencing and Duvelisib or CK1α silencing alone. (D) Representative WB analysis of Mcl1, Procaspase-3, and PARP cleavage in Jeko-1 and Rec-1 treated with Duv (10 µM for Jeko-1 and 5µM for Rec-1) for 48h and with D4476 40 µM for the last 24h (upper panel) and Jeko-1 IPTG inducible CSNK1A1 directed shRNA clone (named CK1α shRNA) treated with IPTG 500µM for 13 days and with Duv 10 µM for the last 24h, (lower panel). CK1α antibody was used to monitor the silencing efficacy. β actin was used as loading control. The figure shows a representative WB, that was performed on at least 3 independent experiments. (E) Synergistic effect of D4476 and Duv in reducing cell viability. Dose response curve of Jeko-1 (upper) and Granta-519 (bottom) incubated for 72 hours with increasing concentrations of D4476 alone, (green squared curve), of Duv alone (light blue star curve), and with the combination of D4476 and Duv (black filled circle curve). Cell viability was assessed with MTT test and reported as percentage over untreated cells. In Jeko-1, IC50 for D4476 alone was 41.5μM and for Duv alone was 16,85µM. IC50 for D4476 used in combination with Duv was 18,63μM, while IC50 for Duv used together with D4476 was 3,95 μM. The CI between D4476 and Duv was calculated as to be 0.68. In Granta-519, IC50 for D4476 alone was 32μM and for Duv alone was 71µM. IC50 for D4476 used in combination with Duv was 14,41 μM, while IC50 for Duv used together with D4476 was 32,27μM. The CI between D4476 and Ibrutinib was calculated as to be 0.90.

