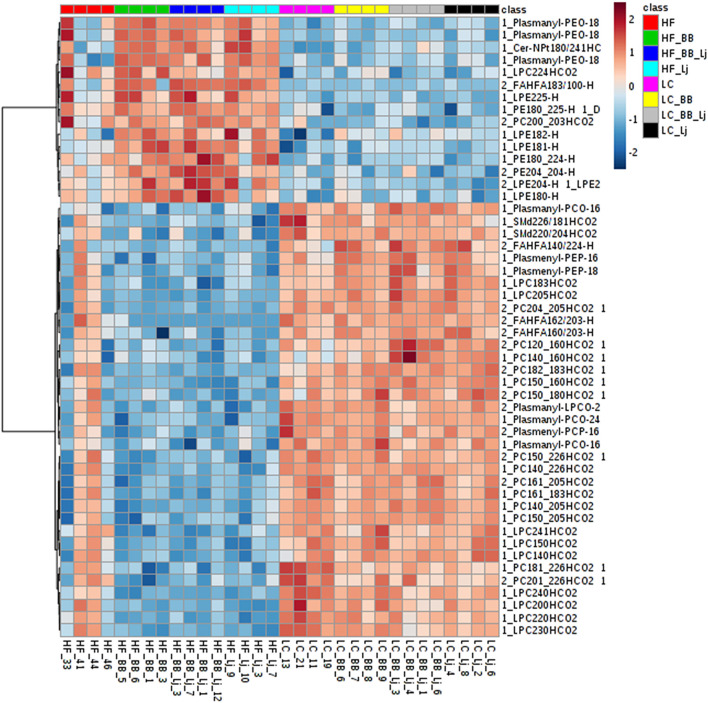
Figure 3.
A heatmap of the top 50 lipids species observed on serum samples ranked by T-test to retain the most contrasting pattern. Each colored cell on the map corresponds to a concentration value. Values were measured by Euclidean distance with a Ward clustering algorithm (n = 6 per group). HF, high-fat diet; LC, low-calorie diet; BB, blueberry extract; LJ, L. johnsonii N6.2; BB/LJ, blueberry extract + L. johnsonii N6.2.

