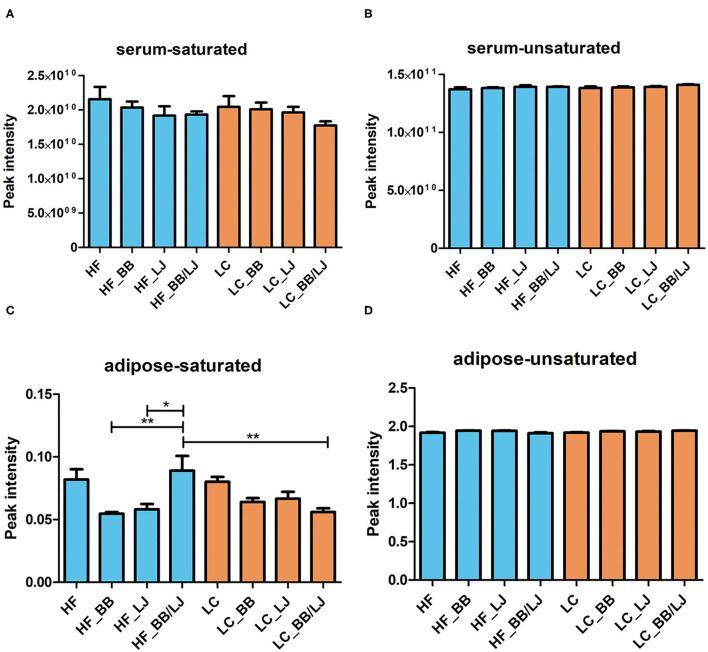
Figure 5.
Average concentration of (A) saturated lipids and (B) unsaturated lipids on serum of the animals, as well as (C) saturated lipids and (D) unsaturated lipids on adipose tissue in the same animals. HF, high-fat diet; LC, low-calorie diet; BB, blueberry extract; LJ, L. johnsonii N6.2; BB/LJ, blueberry extract + L. johnsonii N6.2. Blue bars: animals under HF diet; orange bars: animals under LC diet. Data are summarized as mean and ±standard deviation. *p-value < 0.05; **p-value < 0.01.

